Moroccan vs Immigrants from Taiwan Unemployment Among Ages 30 to 34 years

COMPARE

Moroccan
Race
Ancestry
AfghanAfricanAlaska NativeAlaskan AthabascanAlbanianAleutAlsatianAmericanApacheArabArapahoArgentineanArmenianAssyrian/Chaldean/SyriacAustralianAustrianBahamianBangladeshiBarbadianBasqueBelgianBelizeanBermudanBhutaneseBlackfeetBolivianBrazilianBritishBritish West IndianBulgarianBurmeseCajunCambodianCanadianCape VerdeanCarpatho RusynCelticCentral AmericanCentral American IndianCherokeeCheyenneChickasawChileanChineseChippewaChoctawColombianColvilleComancheCosta RicanCreeCreekCroatianCrowCubanCypriotCzechCzechoslovakianDanishDelawareDominicanDutchDutch West IndianEastern EuropeanEcuadorianEgyptianEnglishEstonianEthiopianEuropeanFijianFilipinoFinnishFrenchFrench American IndianFrench CanadianGermanGerman RussianGhanaianGreekGuamanian/ChamorroGuatemalanGuyaneseHaitianHmongHonduranHopiHoumaHungarianIcelanderIndian (Asian)IndonesianInupiatIranianIraqiIrishIroquoisIsraeliItalianJamaicanJapaneseJordanianKenyanKiowaKoreanLaotianLatvianLebaneseLiberianLithuanianLumbeeLuxembourgerMacedonianMalaysianMalteseMarshalleseMenomineeMexicanMexican American IndianMongolianMoroccanNative HawaiianNavajoNepaleseNew ZealanderNicaraguanNigerianNorthern EuropeanNorwegianOkinawanOsageOttawaPaiutePakistaniPalestinianPanamanianParaguayanPennsylvania GermanPeruvianPimaPolishPortuguesePotawatomiPuebloPuerto RicanPuget Sound SalishRomanianRussianSalvadoranSamoanScandinavianScotch-IrishScottishSeminoleSenegaleseSerbianShoshoneSierra LeoneanSiouxSlavicSlovakSloveneSomaliSouth AfricanSouth AmericanSouth American IndianSoviet UnionSpaniardSpanishSpanish AmericanSpanish American IndianSri LankanSubsaharan AfricanSudaneseSwedishSwissSyrianTaiwaneseThaiTlingit-HaidaTohono O'OdhamTonganTrinidadian and TobagonianTsimshianTurkishU.S. Virgin IslanderUgandanUkrainianUruguayanUteVenezuelanVietnameseWelshWest IndianYakamaYaquiYugoslavianYumanYup'ikZimbabwean
Immigration
NonimmigrantsImmigrantsAfghanistanAfricaAlbaniaArgentinaArmeniaAsiaAustraliaAustriaBahamasBangladeshBarbadosBelarusBelgiumBelizeBoliviaBosnia and HerzegovinaBrazilBulgariaBurma/MyanmarCabo VerdeCambodiaCameroonCanadaCaribbeanCentral AmericaChileChinaColombiaCongoCosta RicaCroatiaCubaCzechoslovakiaDenmarkDominicaDominican RepublicEastern AfricaEastern AsiaEastern EuropeEcuadorEgyptEl SalvadorEnglandEritreaEthiopiaEuropeFijiFranceGermanyGhanaGreeceGrenadaGuatemalaGuyanaHaitiHondurasHong KongHungaryIndiaIndonesiaIranIraqIrelandIsraelItalyJamaicaJapanJordanKazakhstanKenyaKoreaKuwaitLaosLatin AmericaLatviaLebanonLiberiaLithuaniaMalaysiaMexicoMicronesiaMiddle AfricaMoldovaMoroccoNepalNetherlandsNicaraguaNigeriaNorth AmericaNorth MacedoniaNorthern AfricaNorthern EuropeNorwayOceaniaPakistanPanamaPeruPhilippinesPolandPortugalRomaniaRussiaSaudi ArabiaScotlandSenegalSerbiaSierra LeoneSingaporeSomaliaSouth AfricaSouth AmericaSouth Central AsiaSouth Eastern AsiaSouthern EuropeSpainSri LankaSt. Vincent and the GrenadinesSudanSwedenSwitzerlandSyriaThailandTrinidad and TobagoTurkeyUgandaUkraineUruguayUzbekistanVenezuelaVietnamWest IndiesWestern AfricaWestern AsiaWestern EuropeYemenZaireZimbabweAzores
Immigrants from Taiwan
Race
Ancestry
AfghanAfricanAlaska NativeAlaskan AthabascanAlbanianAleutAlsatianAmericanApacheArabArapahoArgentineanArmenianAssyrian/Chaldean/SyriacAustralianAustrianBahamianBangladeshiBarbadianBasqueBelgianBelizeanBermudanBhutaneseBlackfeetBolivianBrazilianBritishBritish West IndianBulgarianBurmeseCajunCambodianCanadianCape VerdeanCarpatho RusynCelticCentral AmericanCentral American IndianCherokeeCheyenneChickasawChileanChineseChippewaChoctawColombianColvilleComancheCosta RicanCreeCreekCroatianCrowCubanCypriotCzechCzechoslovakianDanishDelawareDominicanDutchDutch West IndianEastern EuropeanEcuadorianEgyptianEnglishEstonianEthiopianEuropeanFijianFilipinoFinnishFrenchFrench American IndianFrench CanadianGermanGerman RussianGhanaianGreekGuamanian/ChamorroGuatemalanGuyaneseHaitianHmongHonduranHopiHoumaHungarianIcelanderIndian (Asian)IndonesianInupiatIranianIraqiIrishIroquoisIsraeliItalianJamaicanJapaneseJordanianKenyanKiowaKoreanLaotianLatvianLebaneseLiberianLithuanianLumbeeLuxembourgerMacedonianMalaysianMalteseMarshalleseMenomineeMexicanMexican American IndianMongolianNative HawaiianNavajoNepaleseNew ZealanderNicaraguanNigerianNorthern EuropeanNorwegianOkinawanOsageOttawaPaiutePakistaniPalestinianPanamanianParaguayanPennsylvania GermanPeruvianPimaPolishPortuguesePotawatomiPuebloPuerto RicanPuget Sound SalishRomanianRussianSalvadoranSamoanScandinavianScotch-IrishScottishSeminoleSenegaleseSerbianShoshoneSierra LeoneanSiouxSlavicSlovakSloveneSomaliSouth AfricanSouth AmericanSouth American IndianSoviet UnionSpaniardSpanishSpanish AmericanSpanish American IndianSri LankanSubsaharan AfricanSudaneseSwedishSwissSyrianTaiwaneseThaiTlingit-HaidaTohono O'OdhamTonganTrinidadian and TobagonianTsimshianTurkishU.S. Virgin IslanderUgandanUkrainianUruguayanUteVenezuelanVietnameseWelshWest IndianYakamaYaquiYugoslavianYumanYup'ikZimbabwean
Immigration
NonimmigrantsImmigrantsAfghanistanAfricaAlbaniaArgentinaArmeniaAsiaAustraliaAustriaBahamasBangladeshBarbadosBelarusBelgiumBelizeBoliviaBosnia and HerzegovinaBrazilBulgariaBurma/MyanmarCabo VerdeCambodiaCameroonCanadaCaribbeanCentral AmericaChileChinaColombiaCongoCosta RicaCroatiaCubaCzechoslovakiaDenmarkDominicaDominican RepublicEastern AfricaEastern AsiaEastern EuropeEcuadorEgyptEl SalvadorEnglandEritreaEthiopiaEuropeFijiFranceGermanyGhanaGreeceGrenadaGuatemalaGuyanaHaitiHondurasHong KongHungaryIndiaIndonesiaIranIraqIrelandIsraelItalyJamaicaJapanJordanKazakhstanKenyaKoreaKuwaitLaosLatin AmericaLatviaLebanonLiberiaLithuaniaMalaysiaMexicoMicronesiaMiddle AfricaMoldovaMoroccoNepalNetherlandsNicaraguaNigeriaNorth AmericaNorth MacedoniaNorthern AfricaNorthern EuropeNorwayOceaniaPakistanPanamaPeruPhilippinesPolandPortugalRomaniaRussiaSaudi ArabiaScotlandSenegalSerbiaSierra LeoneSingaporeSomaliaSouth AfricaSouth AmericaSouth Central AsiaSouth Eastern AsiaSouthern EuropeSpainSri LankaSt. Vincent and the GrenadinesSudanSwedenSwitzerlandSyriaTaiwanThailandTrinidad and TobagoTurkeyUgandaUkraineUruguayUzbekistanVenezuelaVietnamWest IndiesWestern AfricaWestern AsiaWestern EuropeYemenZaireZimbabweAzores
Unemployment Among Ages 30 to 34 years
Income
Poverty
Unemployment
Labor Participation
Family Structure
Vehicle Availability
Education Level
Disability

Unemployment Among Ages 30 to 34 years Comparison

Moroccans

Immigrants from Taiwan

Fair
Exceptional
5.5%
UNEMPLOYMENT AMONG AGES 30 TO 34 YEARS
31.2/ 100
METRIC RATING
192nd/ 347
METRIC RANK
4.9%
UNEMPLOYMENT AMONG AGES 30 TO 34 YEARS
99.8/ 100
METRIC RATING
20th/ 347
METRIC RANK

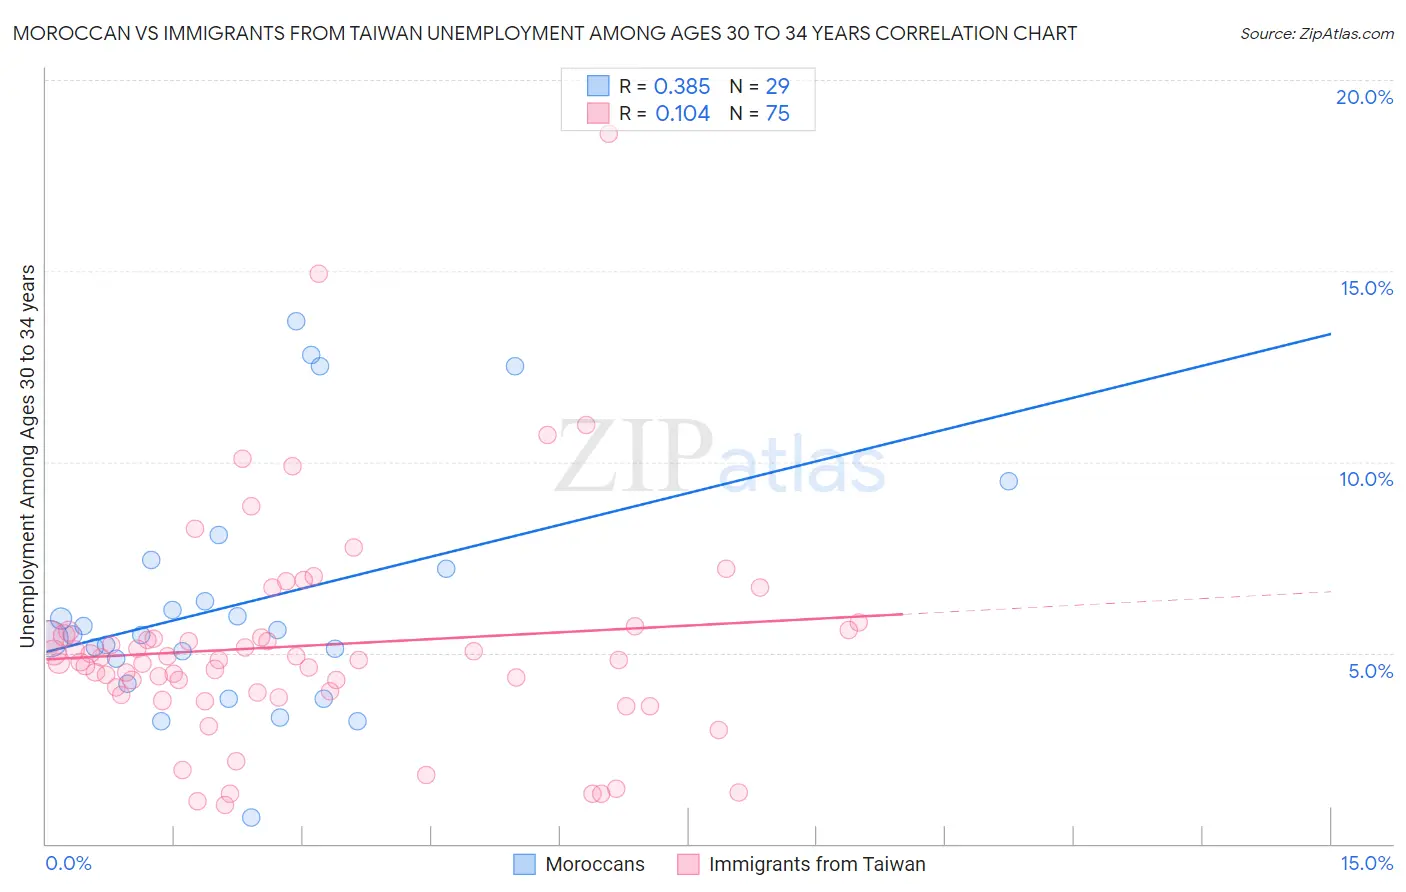
Moroccan vs Immigrants from Taiwan Unemployment Among Ages 30 to 34 years Correlation Chart

The statistical analysis conducted on geographies consisting of 197,215,182 people shows a mild positive correlation between the proportion of Moroccans and unemployment rate among population between the ages 30 and 34 in the United States with a correlation coefficient (R) of 0.385 and weighted average of 5.5%. Similarly, the statistical analysis conducted on geographies consisting of 285,904,968 people shows a poor positive correlation between the proportion of Immigrants from Taiwan and unemployment rate among population between the ages 30 and 34 in the United States with a correlation coefficient (R) of 0.104 and weighted average of 4.9%, a difference of 13.9%.
Moroccan vs Immigrants from Taiwan Unemployment Among Ages 30 to 34 years

Unemployment Among Ages 30 to 34 years Correlation Summary

MeasurementMoroccanImmigrants from Taiwan
Minimum0.70%1.0%
Maximum13.7%18.6%
Range13.0%17.6%
Mean6.3%5.2%
Median5.5%4.8%
Interquartile 25% (IQ1)4.5%4.0%
Interquartile 75% (IQ3)7.3%5.6%
Interquartile Range (IQR)2.8%1.6%
Standard Deviation (Sample)3.1%2.9%
Standard Deviation (Population)3.1%2.8%

Similar Demographics by Unemployment Among Ages 30 to 34 years

Demographics Similar to Moroccans by Unemployment Among Ages 30 to 34 years

In terms of unemployment among ages 30 to 34 years, the demographic groups most similar to Moroccans are Irish (5.5%, a difference of 0.0%), Immigrants from Africa (5.5%, a difference of 0.020%), Slavic (5.5%, a difference of 0.030%), Finnish (5.5%, a difference of 0.040%), and Immigrants from South America (5.5%, a difference of 0.12%).
DemographicsRating | RankUnemployment Among Ages 30 to 34 years
Immigrants | Western Europe
39.1
/100
|
#185
Fair
5.5%
Canadians
38.2
/100
|
#186
Fair
5.5%
Immigrants | Western Asia
38.2
/100
|
#187
Fair
5.5%
Immigrants | Norway
36.1
/100
|
#188
Fair
5.5%
Immigrants | England
35.7
/100
|
#189
Fair
5.5%
Immigrants | Kazakhstan
33.9
/100
|
#190
Fair
5.5%
Irish
31.3
/100
|
#191
Fair
5.5%
Moroccans
31.2
/100
|
#192
Fair
5.5%
Immigrants | Africa
31.0
/100
|
#193
Fair
5.5%
Slavs
30.9
/100
|
#194
Fair
5.5%
Finns
30.7
/100
|
#195
Fair
5.5%
Immigrants | South America
29.8
/100
|
#196
Fair
5.5%
Immigrants | Nicaragua
28.9
/100
|
#197
Fair
5.5%
Immigrants | Afghanistan
27.2
/100
|
#198
Fair
5.6%
Nicaraguans
26.6
/100
|
#199
Fair
5.6%

Demographics Similar to Immigrants from Taiwan by Unemployment Among Ages 30 to 34 years

In terms of unemployment among ages 30 to 34 years, the demographic groups most similar to Immigrants from Taiwan are Ethiopian (4.9%, a difference of 0.010%), Immigrants from Sudan (4.9%, a difference of 0.020%), Bolivian (4.9%, a difference of 0.080%), Immigrants from South Central Asia (4.9%, a difference of 0.22%), and Hmong (4.9%, a difference of 0.39%).
DemographicsRating | RankUnemployment Among Ages 30 to 34 years
Cambodians
99.9
/100
|
#13
Exceptional
4.8%
Luxembourgers
99.9
/100
|
#14
Exceptional
4.8%
Okinawans
99.9
/100
|
#15
Exceptional
4.8%
Zimbabweans
99.9
/100
|
#16
Exceptional
4.8%
Immigrants | Bulgaria
99.9
/100
|
#17
Exceptional
4.8%
Bolivians
99.8
/100
|
#18
Exceptional
4.9%
Immigrants | Sudan
99.8
/100
|
#19
Exceptional
4.9%
Immigrants | Taiwan
99.8
/100
|
#20
Exceptional
4.9%
Ethiopians
99.8
/100
|
#21
Exceptional
4.9%
Immigrants | South Central Asia
99.8
/100
|
#22
Exceptional
4.9%
Hmong
99.8
/100
|
#23
Exceptional
4.9%
Ugandans
99.7
/100
|
#24
Exceptional
4.9%
Immigrants | Singapore
99.5
/100
|
#25
Exceptional
5.0%
Immigrants | Kuwait
99.5
/100
|
#26
Exceptional
5.0%
Danes
99.5
/100
|
#27
Exceptional
5.0%