South American Indian vs British Female Unemployment
COMPARE
South American Indian
British
Female Unemployment
Female Unemployment Comparison
South American Indians
British
5.5%
FEMALE UNEMPLOYMENT
2.8/ 100
METRIC RATING
241st/ 347
METRIC RANK
4.7%
FEMALE UNEMPLOYMENT
99.9/ 100
METRIC RATING
27th/ 347
METRIC RANK
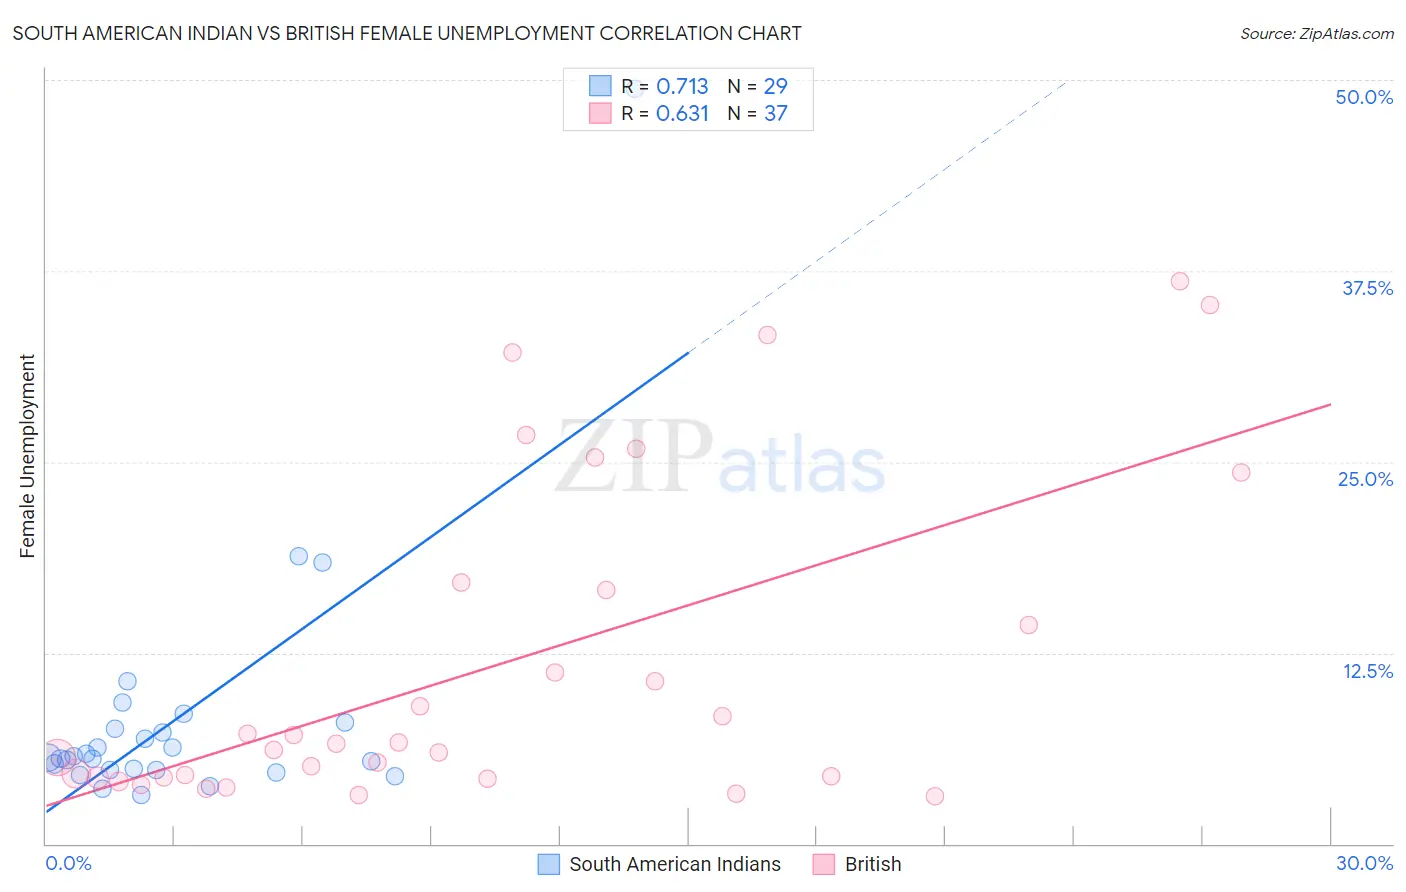
South American Indian vs British Female Unemployment Correlation Chart
The statistical analysis conducted on geographies consisting of 164,368,347 people shows a strong positive correlation between the proportion of South American Indians and unemploymnet rate among females in the United States with a correlation coefficient (R) of 0.713 and weighted average of 5.5%. Similarly, the statistical analysis conducted on geographies consisting of 523,107,564 people shows a significant positive correlation between the proportion of British and unemploymnet rate among females in the United States with a correlation coefficient (R) of 0.631 and weighted average of 4.7%, a difference of 16.9%.
Female Unemployment Correlation Summary
| Measurement | South American Indian | British |
| Minimum | 3.2% | 3.1% |
| Maximum | 49.4% | 36.8% |
| Range | 46.2% | 33.7% |
| Mean | 8.3% | 11.7% |
| Median | 5.6% | 6.5% |
| Interquartile 25% (IQ1) | 4.8% | 4.3% |
| Interquartile 75% (IQ3) | 7.7% | 16.8% |
| Interquartile Range (IQR) | 2.9% | 12.5% |
| Standard Deviation (Sample) | 8.7% | 10.5% |
| Standard Deviation (Population) | 8.6% | 10.4% |
Similar Demographics by Female Unemployment
Demographics Similar to South American Indians by Female Unemployment
In terms of female unemployment, the demographic groups most similar to South American Indians are Immigrants from South America (5.5%, a difference of 0.050%), Aleut (5.5%, a difference of 0.080%), Sierra Leonean (5.5%, a difference of 0.18%), Immigrants from Panama (5.5%, a difference of 0.20%), and Immigrants from Cambodia (5.5%, a difference of 0.23%).
| Demographics | Rating | Rank | Female Unemployment |
| Immigrants | Lebanon | 3.3 /100 | #234 | Tragic 5.5% |
| Immigrants | Iran | 3.3 /100 | #235 | Tragic 5.5% |
| Immigrants | Cambodia | 3.3 /100 | #236 | Tragic 5.5% |
| Immigrants | Panama | 3.2 /100 | #237 | Tragic 5.5% |
| Sierra Leoneans | 3.2 /100 | #238 | Tragic 5.5% |
| Aleuts | 3.0 /100 | #239 | Tragic 5.5% |
| Immigrants | South America | 2.9 /100 | #240 | Tragic 5.5% |
| South American Indians | 2.8 /100 | #241 | Tragic 5.5% |
| Marshallese | 2.3 /100 | #242 | Tragic 5.6% |
| Spanish Americans | 2.2 /100 | #243 | Tragic 5.6% |
| Immigrants | Liberia | 1.5 /100 | #244 | Tragic 5.6% |
| Guamanians/Chamorros | 1.4 /100 | #245 | Tragic 5.6% |
| Japanese | 1.2 /100 | #246 | Tragic 5.6% |
| Immigrants | Western Asia | 1.1 /100 | #247 | Tragic 5.6% |
| Cree | 1.0 /100 | #248 | Tragic 5.6% |
Demographics Similar to British by Female Unemployment
In terms of female unemployment, the demographic groups most similar to British are Irish (4.7%, a difference of 0.030%), Cypriot (4.7%, a difference of 0.040%), Lithuanian (4.7%, a difference of 0.16%), Immigrants from Bosnia and Herzegovina (4.7%, a difference of 0.17%), and Immigrants from India (4.7%, a difference of 0.20%).
| Demographics | Rating | Rank | Female Unemployment |
| Bulgarians | 99.9 /100 | #20 | Exceptional 4.7% |
| Fijians | 99.9 /100 | #21 | Exceptional 4.7% |
| Europeans | 99.9 /100 | #22 | Exceptional 4.7% |
| Scottish | 99.9 /100 | #23 | Exceptional 4.7% |
| Welsh | 99.9 /100 | #24 | Exceptional 4.7% |
| Immigrants | India | 99.9 /100 | #25 | Exceptional 4.7% |
| Immigrants | Bosnia and Herzegovina | 99.9 /100 | #26 | Exceptional 4.7% |
| British | 99.9 /100 | #27 | Exceptional 4.7% |
| Irish | 99.9 /100 | #28 | Exceptional 4.7% |
| Cypriots | 99.9 /100 | #29 | Exceptional 4.7% |
| Lithuanians | 99.8 /100 | #30 | Exceptional 4.7% |
| Sudanese | 99.8 /100 | #31 | Exceptional 4.8% |
| Slovaks | 99.8 /100 | #32 | Exceptional 4.8% |
| Czechoslovakians | 99.7 /100 | #33 | Exceptional 4.8% |
| Zimbabweans | 99.7 /100 | #34 | Exceptional 4.8% |