South African vs Peruvian Child Poverty Among Boys Under 16
COMPARE
South African
Peruvian
Child Poverty Among Boys Under 16
Child Poverty Among Boys Under 16 Comparison
South Africans
Peruvians
15.2%
CHILD POVERTY AMONG BOYS UNDER 16
93.0/ 100
METRIC RATING
120th/ 347
METRIC RANK
15.5%
CHILD POVERTY AMONG BOYS UNDER 16
88.1/ 100
METRIC RATING
134th/ 347
METRIC RANK
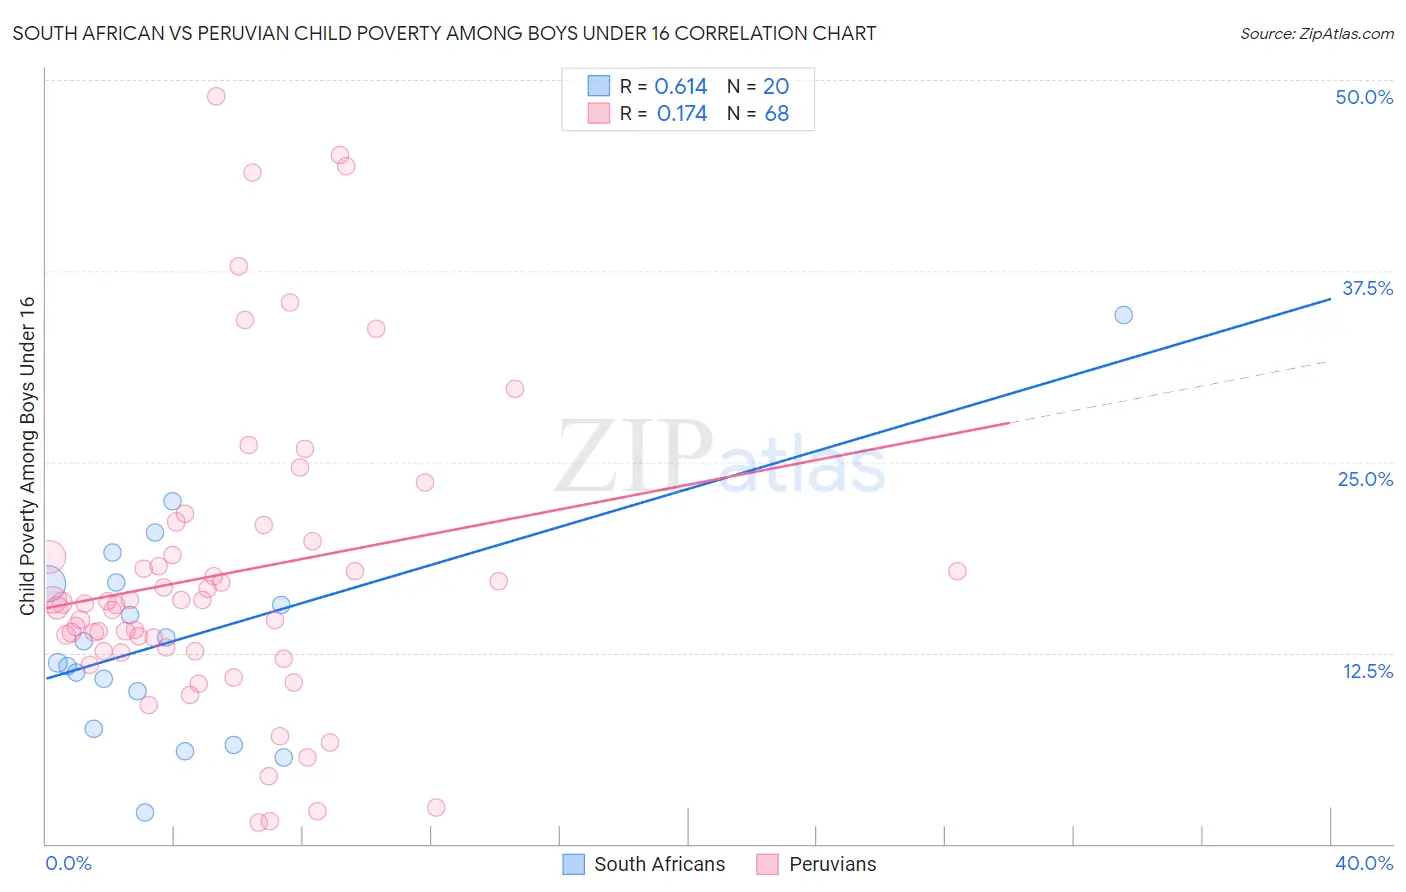
South African vs Peruvian Child Poverty Among Boys Under 16 Correlation Chart
The statistical analysis conducted on geographies consisting of 180,617,887 people shows a significant positive correlation between the proportion of South Africans and poverty level among boys under the age of 16 in the United States with a correlation coefficient (R) of 0.614 and weighted average of 15.2%. Similarly, the statistical analysis conducted on geographies consisting of 358,179,788 people shows a poor positive correlation between the proportion of Peruvians and poverty level among boys under the age of 16 in the United States with a correlation coefficient (R) of 0.174 and weighted average of 15.5%, a difference of 1.8%.
Child Poverty Among Boys Under 16 Correlation Summary
| Measurement | South African | Peruvian |
| Minimum | 2.1% | 1.4% |
| Maximum | 34.6% | 48.9% |
| Range | 32.6% | 47.5% |
| Mean | 13.6% | 17.6% |
| Median | 12.5% | 15.7% |
| Interquartile 25% (IQ1) | 8.8% | 12.6% |
| Interquartile 75% (IQ3) | 17.0% | 19.4% |
| Interquartile Range (IQR) | 8.2% | 6.8% |
| Standard Deviation (Sample) | 7.2% | 10.2% |
| Standard Deviation (Population) | 7.1% | 10.1% |
Demographics Similar to South Africans and Peruvians by Child Poverty Among Boys Under 16
In terms of child poverty among boys under 16, the demographic groups most similar to South Africans are Scottish (15.2%, a difference of 0.010%), Belgian (15.2%, a difference of 0.050%), Immigrants from Malaysia (15.3%, a difference of 0.11%), Native Hawaiian (15.2%, a difference of 0.17%), and Immigrants from Vietnam (15.2%, a difference of 0.23%). Similarly, the demographic groups most similar to Peruvians are Welsh (15.5%, a difference of 0.040%), Immigrants from Kazakhstan (15.5%, a difference of 0.15%), Portuguese (15.5%, a difference of 0.17%), Icelander (15.5%, a difference of 0.19%), and Immigrants from Spain (15.6%, a difference of 0.29%).
| Demographics | Rating | Rank | Child Poverty Among Boys Under 16 |
| Immigrants | Vietnam | 93.5 /100 | #117 | Exceptional 15.2% |
| Native Hawaiians | 93.4 /100 | #118 | Exceptional 15.2% |
| Belgians | 93.1 /100 | #119 | Exceptional 15.2% |
| South Africans | 93.0 /100 | #120 | Exceptional 15.2% |
| Scottish | 93.0 /100 | #121 | Exceptional 15.2% |
| Immigrants | Malaysia | 92.8 /100 | #122 | Exceptional 15.3% |
| Immigrants | Norway | 92.3 /100 | #123 | Exceptional 15.3% |
| Tlingit-Haida | 92.2 /100 | #124 | Exceptional 15.3% |
| Czechoslovakians | 92.1 /100 | #125 | Exceptional 15.3% |
| Palestinians | 91.3 /100 | #126 | Exceptional 15.4% |
| Carpatho Rusyns | 91.1 /100 | #127 | Exceptional 15.4% |
| Canadians | 90.6 /100 | #128 | Exceptional 15.4% |
| Immigrants | Brazil | 90.3 /100 | #129 | Exceptional 15.4% |
| Mongolians | 90.2 /100 | #130 | Exceptional 15.4% |
| Immigrants | Western Europe | 90.0 /100 | #131 | Exceptional 15.4% |
| Immigrants | Kazakhstan | 88.7 /100 | #132 | Excellent 15.5% |
| Welsh | 88.3 /100 | #133 | Excellent 15.5% |
| Peruvians | 88.1 /100 | #134 | Excellent 15.5% |
| Portuguese | 87.5 /100 | #135 | Excellent 15.5% |
| Icelanders | 87.5 /100 | #136 | Excellent 15.5% |
| Immigrants | Spain | 87.1 /100 | #137 | Excellent 15.6% |