South African vs Immigrants from Bulgaria Male Unemployment
COMPARE
South African
Immigrants from Bulgaria
Male Unemployment
Male Unemployment Comparison
South Africans
Immigrants from Bulgaria
5.0%
MALE UNEMPLOYMENT
96.4/ 100
METRIC RATING
79th/ 347
METRIC RANK
5.0%
MALE UNEMPLOYMENT
98.7/ 100
METRIC RATING
56th/ 347
METRIC RANK
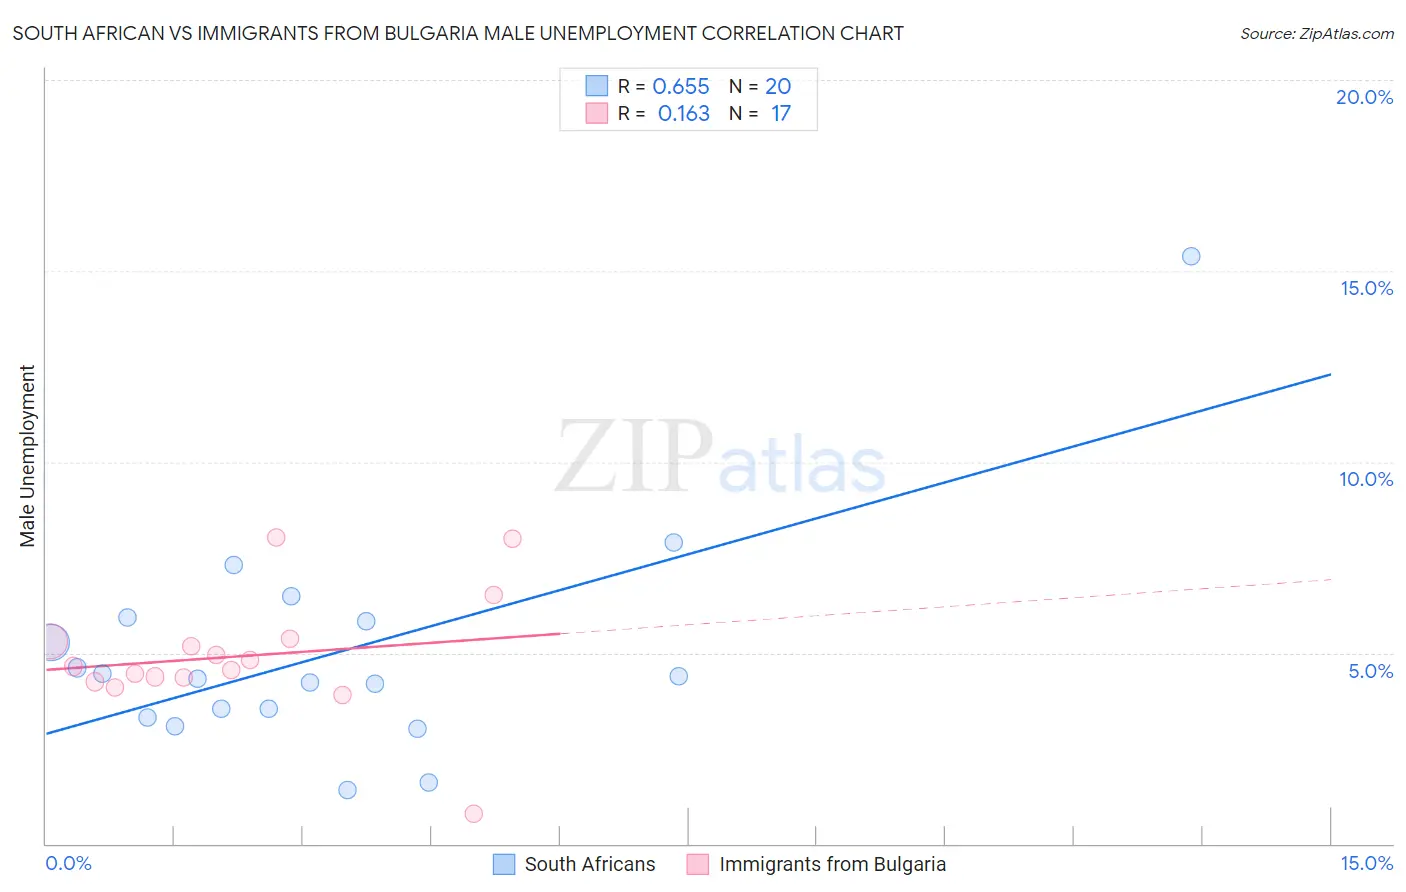
South African vs Immigrants from Bulgaria Male Unemployment Correlation Chart
The statistical analysis conducted on geographies consisting of 182,243,943 people shows a significant positive correlation between the proportion of South Africans and unemployment rate among males in the United States with a correlation coefficient (R) of 0.655 and weighted average of 5.0%. Similarly, the statistical analysis conducted on geographies consisting of 172,373,504 people shows a poor positive correlation between the proportion of Immigrants from Bulgaria and unemployment rate among males in the United States with a correlation coefficient (R) of 0.163 and weighted average of 5.0%, a difference of 1.6%.
Male Unemployment Correlation Summary
| Measurement | South African | Immigrants from Bulgaria |
| Minimum | 1.4% | 0.80% |
| Maximum | 15.4% | 8.0% |
| Range | 14.0% | 7.2% |
| Mean | 5.0% | 4.9% |
| Median | 4.4% | 4.6% |
| Interquartile 25% (IQ1) | 3.4% | 4.3% |
| Interquartile 75% (IQ3) | 5.9% | 5.3% |
| Interquartile Range (IQR) | 2.4% | 1.0% |
| Standard Deviation (Sample) | 3.0% | 1.6% |
| Standard Deviation (Population) | 2.9% | 1.6% |
Similar Demographics by Male Unemployment
Demographics Similar to South Africans by Male Unemployment
In terms of male unemployment, the demographic groups most similar to South Africans are Immigrants from Northern Europe (5.0%, a difference of 0.010%), Iranian (5.0%, a difference of 0.020%), Argentinean (5.0%, a difference of 0.050%), French (5.0%, a difference of 0.050%), and Immigrants from Sudan (5.0%, a difference of 0.070%).
| Demographics | Rating | Rank | Male Unemployment |
| Immigrants | South Africa | 97.1 /100 | #72 | Exceptional 5.0% |
| Greeks | 97.0 /100 | #73 | Exceptional 5.0% |
| Immigrants | North America | 96.9 /100 | #74 | Exceptional 5.0% |
| Assyrians/Chaldeans/Syriacs | 96.9 /100 | #75 | Exceptional 5.0% |
| Immigrants | Sudan | 96.5 /100 | #76 | Exceptional 5.0% |
| Iranians | 96.4 /100 | #77 | Exceptional 5.0% |
| Immigrants | Northern Europe | 96.4 /100 | #78 | Exceptional 5.0% |
| South Africans | 96.4 /100 | #79 | Exceptional 5.0% |
| Argentineans | 96.2 /100 | #80 | Exceptional 5.0% |
| French | 96.2 /100 | #81 | Exceptional 5.0% |
| Chileans | 96.2 /100 | #82 | Exceptional 5.0% |
| Immigrants | Eritrea | 96.0 /100 | #83 | Exceptional 5.0% |
| Serbians | 95.7 /100 | #84 | Exceptional 5.1% |
| Immigrants | North Macedonia | 95.6 /100 | #85 | Exceptional 5.1% |
| Maltese | 95.5 /100 | #86 | Exceptional 5.1% |
Demographics Similar to Immigrants from Bulgaria by Male Unemployment
In terms of male unemployment, the demographic groups most similar to Immigrants from Bulgaria are Czechoslovakian (5.0%, a difference of 0.0%), Yugoslavian (5.0%, a difference of 0.010%), Jordanian (5.0%, a difference of 0.11%), Irish (5.0%, a difference of 0.17%), and Slovene (5.0%, a difference of 0.19%).
| Demographics | Rating | Rank | Male Unemployment |
| Poles | 98.9 /100 | #49 | Exceptional 4.9% |
| Croatians | 98.9 /100 | #50 | Exceptional 4.9% |
| Slovenes | 98.8 /100 | #51 | Exceptional 5.0% |
| Irish | 98.8 /100 | #52 | Exceptional 5.0% |
| Jordanians | 98.8 /100 | #53 | Exceptional 5.0% |
| Yugoslavians | 98.7 /100 | #54 | Exceptional 5.0% |
| Czechoslovakians | 98.7 /100 | #55 | Exceptional 5.0% |
| Immigrants | Bulgaria | 98.7 /100 | #56 | Exceptional 5.0% |
| Turks | 98.5 /100 | #57 | Exceptional 5.0% |
| Lithuanians | 98.5 /100 | #58 | Exceptional 5.0% |
| Immigrants | Netherlands | 98.3 /100 | #59 | Exceptional 5.0% |
| Immigrants | Argentina | 98.1 /100 | #60 | Exceptional 5.0% |
| Cambodians | 98.1 /100 | #61 | Exceptional 5.0% |
| Basques | 97.9 /100 | #62 | Exceptional 5.0% |
| Eastern Europeans | 97.9 /100 | #63 | Exceptional 5.0% |