South African vs Filipino Unemployment Among Women with Children Ages 6 to 17 years
COMPARE
South African
Filipino
Unemployment Among Women with Children Ages 6 to 17 years
Unemployment Among Women with Children Ages 6 to 17 years Comparison
South Africans
Filipinos
8.7%
UNEMPLOYMENT AMONG WOMEN WITH CHILDREN AGES 6 TO 17 YEARS
94.6/ 100
METRIC RATING
125th/ 347
METRIC RANK
7.6%
UNEMPLOYMENT AMONG WOMEN WITH CHILDREN AGES 6 TO 17 YEARS
100.0/ 100
METRIC RATING
19th/ 347
METRIC RANK
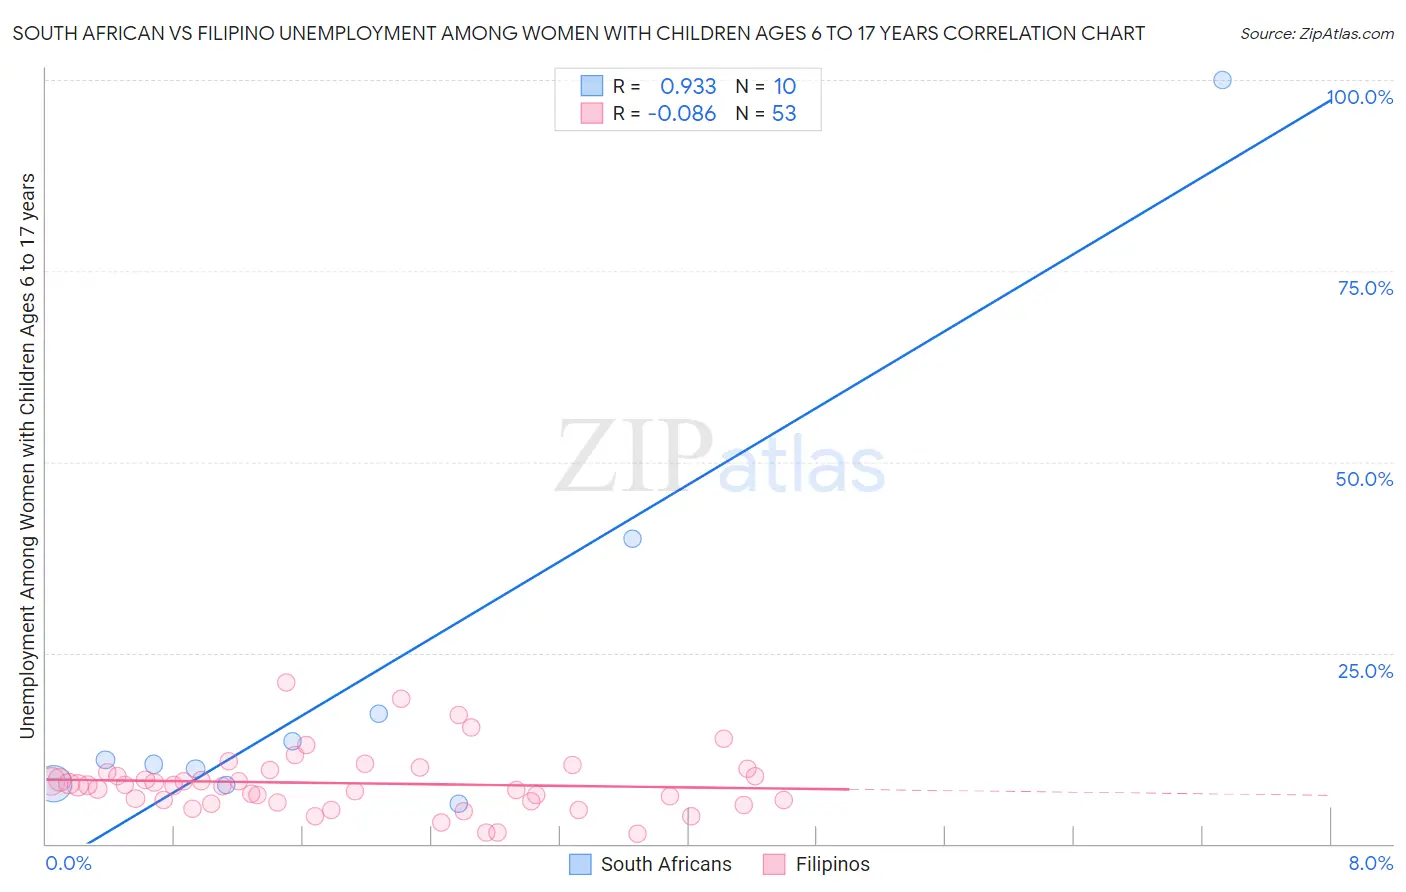
South African vs Filipino Unemployment Among Women with Children Ages 6 to 17 years Correlation Chart
The statistical analysis conducted on geographies consisting of 145,059,046 people shows a near-perfect positive correlation between the proportion of South Africans and unemployment rate among women with children between the ages 6 and 17 in the United States with a correlation coefficient (R) of 0.933 and weighted average of 8.7%. Similarly, the statistical analysis conducted on geographies consisting of 196,913,361 people shows a slight negative correlation between the proportion of Filipinos and unemployment rate among women with children between the ages 6 and 17 in the United States with a correlation coefficient (R) of -0.086 and weighted average of 7.6%, a difference of 14.5%.
Unemployment Among Women with Children Ages 6 to 17 years Correlation Summary
| Measurement | South African | Filipino |
| Minimum | 5.3% | 1.3% |
| Maximum | 100.0% | 21.1% |
| Range | 94.7% | 19.8% |
| Mean | 22.3% | 7.9% |
| Median | 10.7% | 7.6% |
| Interquartile 25% (IQ1) | 7.9% | 5.5% |
| Interquartile 75% (IQ3) | 17.0% | 9.5% |
| Interquartile Range (IQR) | 9.1% | 4.0% |
| Standard Deviation (Sample) | 29.0% | 4.0% |
| Standard Deviation (Population) | 27.6% | 3.9% |
Similar Demographics by Unemployment Among Women with Children Ages 6 to 17 years
Demographics Similar to South Africans by Unemployment Among Women with Children Ages 6 to 17 years
In terms of unemployment among women with children ages 6 to 17 years, the demographic groups most similar to South Africans are Immigrants from Northern Africa (8.7%, a difference of 0.030%), Czech (8.7%, a difference of 0.030%), Hmong (8.7%, a difference of 0.050%), Immigrants from Morocco (8.7%, a difference of 0.070%), and Immigrants from Lebanon (8.7%, a difference of 0.070%).
| Demographics | Rating | Rank | Unemployment Among Women with Children Ages 6 to 17 years |
| Pueblo | 96.2 /100 | #118 | Exceptional 8.6% |
| Immigrants | Grenada | 96.2 /100 | #119 | Exceptional 8.6% |
| Israelis | 95.9 /100 | #120 | Exceptional 8.7% |
| Immigrants | Denmark | 95.5 /100 | #121 | Exceptional 8.7% |
| Immigrants | Egypt | 95.0 /100 | #122 | Exceptional 8.7% |
| Immigrants | Morocco | 94.9 /100 | #123 | Exceptional 8.7% |
| Immigrants | Lebanon | 94.9 /100 | #124 | Exceptional 8.7% |
| South Africans | 94.6 /100 | #125 | Exceptional 8.7% |
| Immigrants | Northern Africa | 94.4 /100 | #126 | Exceptional 8.7% |
| Czechs | 94.4 /100 | #127 | Exceptional 8.7% |
| Hmong | 94.3 /100 | #128 | Exceptional 8.7% |
| Barbadians | 93.8 /100 | #129 | Exceptional 8.7% |
| Immigrants | Western Asia | 93.1 /100 | #130 | Exceptional 8.7% |
| Slavs | 92.2 /100 | #131 | Exceptional 8.7% |
| Yaqui | 92.2 /100 | #132 | Exceptional 8.7% |
Demographics Similar to Filipinos by Unemployment Among Women with Children Ages 6 to 17 years
In terms of unemployment among women with children ages 6 to 17 years, the demographic groups most similar to Filipinos are Afghan (7.6%, a difference of 0.020%), Cambodian (7.5%, a difference of 0.68%), Immigrants from Burma/Myanmar (7.5%, a difference of 0.86%), Immigrants from Singapore (7.7%, a difference of 1.0%), and Immigrants from India (7.7%, a difference of 1.1%).
| Demographics | Rating | Rank | Unemployment Among Women with Children Ages 6 to 17 years |
| Bangladeshis | 100.0 /100 | #12 | Exceptional 7.4% |
| Indonesians | 100.0 /100 | #13 | Exceptional 7.4% |
| Sudanese | 100.0 /100 | #14 | Exceptional 7.4% |
| Puget Sound Salish | 100.0 /100 | #15 | Exceptional 7.5% |
| Immigrants | Burma/Myanmar | 100.0 /100 | #16 | Exceptional 7.5% |
| Cambodians | 100.0 /100 | #17 | Exceptional 7.5% |
| Afghans | 100.0 /100 | #18 | Exceptional 7.6% |
| Filipinos | 100.0 /100 | #19 | Exceptional 7.6% |
| Immigrants | Singapore | 100.0 /100 | #20 | Exceptional 7.7% |
| Immigrants | India | 100.0 /100 | #21 | Exceptional 7.7% |
| Immigrants | China | 100.0 /100 | #22 | Exceptional 7.7% |
| Immigrants | Indonesia | 100.0 /100 | #23 | Exceptional 7.7% |
| Nepalese | 100.0 /100 | #24 | Exceptional 7.7% |
| Immigrants | Eastern Asia | 100.0 /100 | #25 | Exceptional 7.7% |
| Indians (Asian) | 100.0 /100 | #26 | Exceptional 7.7% |