Immigrants from South Central Asia vs Filipino Unemployment Among Women with Children Ages 6 to 17 years
COMPARE
Immigrants from South Central Asia
Filipino
Unemployment Among Women with Children Ages 6 to 17 years
Unemployment Among Women with Children Ages 6 to 17 years Comparison
Immigrants from South Central Asia
Filipinos
7.9%
UNEMPLOYMENT AMONG WOMEN WITH CHILDREN AGES 6 TO 17 YEARS
100.0/ 100
METRIC RATING
35th/ 347
METRIC RANK
7.6%
UNEMPLOYMENT AMONG WOMEN WITH CHILDREN AGES 6 TO 17 YEARS
100.0/ 100
METRIC RATING
19th/ 347
METRIC RANK
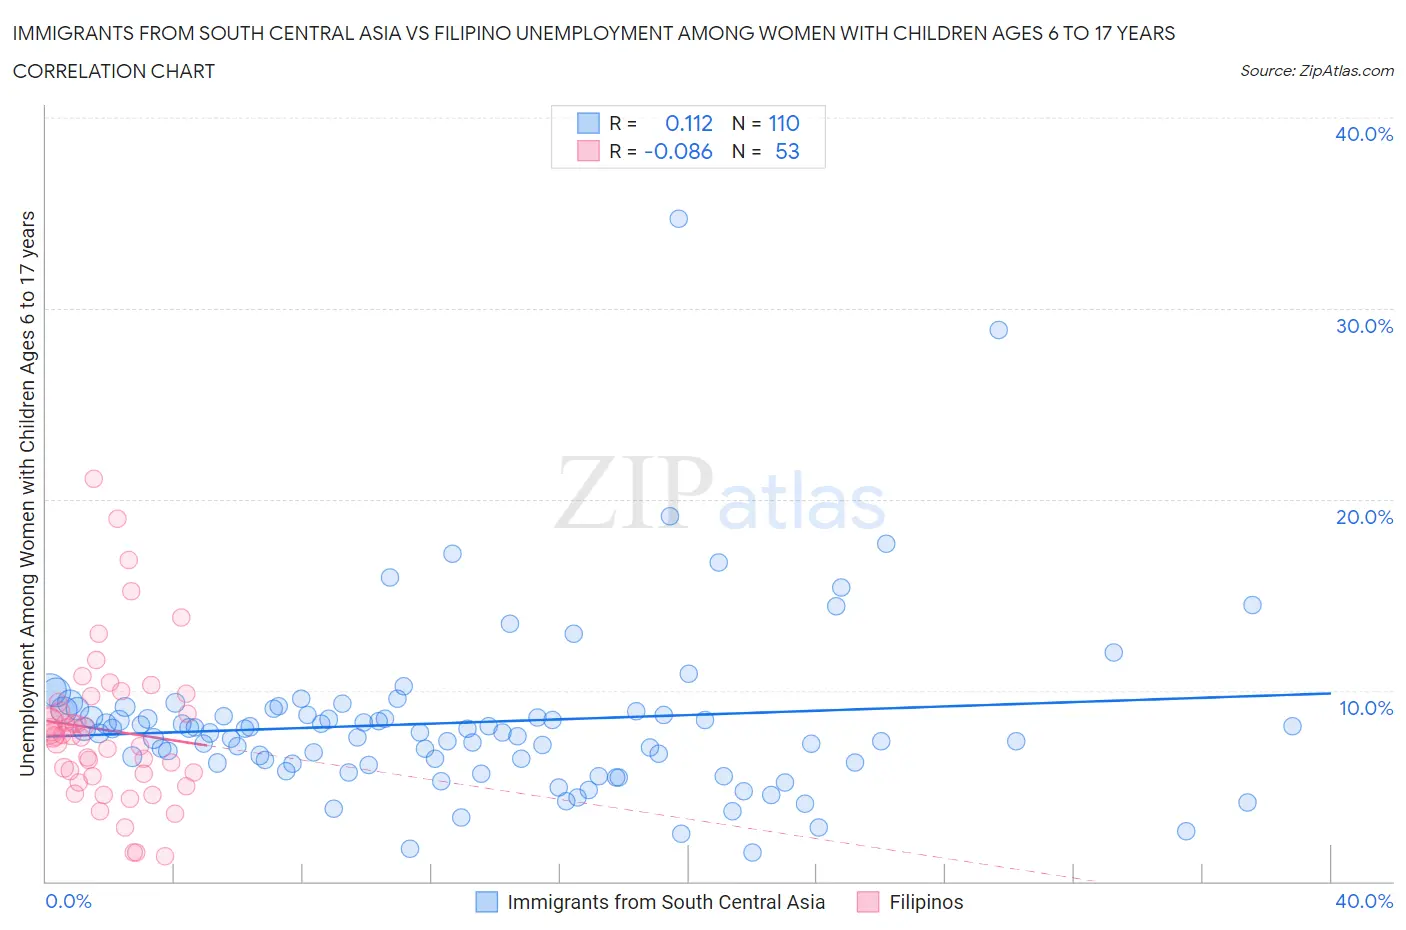
Immigrants from South Central Asia vs Filipino Unemployment Among Women with Children Ages 6 to 17 years Correlation Chart
The statistical analysis conducted on geographies consisting of 326,255,607 people shows a poor positive correlation between the proportion of Immigrants from South Central Asia and unemployment rate among women with children between the ages 6 and 17 in the United States with a correlation coefficient (R) of 0.112 and weighted average of 7.9%. Similarly, the statistical analysis conducted on geographies consisting of 196,913,361 people shows a slight negative correlation between the proportion of Filipinos and unemployment rate among women with children between the ages 6 and 17 in the United States with a correlation coefficient (R) of -0.086 and weighted average of 7.6%, a difference of 4.9%.
Unemployment Among Women with Children Ages 6 to 17 years Correlation Summary
| Measurement | Immigrants from South Central Asia | Filipino |
| Minimum | 1.5% | 1.3% |
| Maximum | 34.7% | 21.1% |
| Range | 33.2% | 19.8% |
| Mean | 8.3% | 7.9% |
| Median | 7.8% | 7.6% |
| Interquartile 25% (IQ1) | 6.2% | 5.5% |
| Interquartile 75% (IQ3) | 8.9% | 9.5% |
| Interquartile Range (IQR) | 2.7% | 4.0% |
| Standard Deviation (Sample) | 4.5% | 4.0% |
| Standard Deviation (Population) | 4.5% | 3.9% |
Demographics Similar to Immigrants from South Central Asia and Filipinos by Unemployment Among Women with Children Ages 6 to 17 years
In terms of unemployment among women with children ages 6 to 17 years, the demographic groups most similar to Immigrants from South Central Asia are Burmese (8.0%, a difference of 0.080%), Native Hawaiian (7.9%, a difference of 0.11%), Asian (8.0%, a difference of 0.11%), Immigrants from Korea (7.9%, a difference of 0.39%), and Immigrants from Cambodia (7.9%, a difference of 0.44%). Similarly, the demographic groups most similar to Filipinos are Afghan (7.6%, a difference of 0.020%), Cambodian (7.5%, a difference of 0.68%), Immigrants from Singapore (7.7%, a difference of 1.0%), Immigrants from India (7.7%, a difference of 1.1%), and Immigrants from China (7.7%, a difference of 1.4%).
| Demographics | Rating | Rank | Unemployment Among Women with Children Ages 6 to 17 years |
| Cambodians | 100.0 /100 | #17 | Exceptional 7.5% |
| Afghans | 100.0 /100 | #18 | Exceptional 7.6% |
| Filipinos | 100.0 /100 | #19 | Exceptional 7.6% |
| Immigrants | Singapore | 100.0 /100 | #20 | Exceptional 7.7% |
| Immigrants | India | 100.0 /100 | #21 | Exceptional 7.7% |
| Immigrants | China | 100.0 /100 | #22 | Exceptional 7.7% |
| Immigrants | Indonesia | 100.0 /100 | #23 | Exceptional 7.7% |
| Nepalese | 100.0 /100 | #24 | Exceptional 7.7% |
| Immigrants | Eastern Asia | 100.0 /100 | #25 | Exceptional 7.7% |
| Indians (Asian) | 100.0 /100 | #26 | Exceptional 7.7% |
| Immigrants | Afghanistan | 100.0 /100 | #27 | Exceptional 7.8% |
| Immigrants | Uzbekistan | 100.0 /100 | #28 | Exceptional 7.8% |
| Thais | 100.0 /100 | #29 | Exceptional 7.8% |
| Immigrants | Iran | 100.0 /100 | #30 | Exceptional 7.9% |
| Laotians | 100.0 /100 | #31 | Exceptional 7.9% |
| Immigrants | Cambodia | 100.0 /100 | #32 | Exceptional 7.9% |
| Immigrants | Korea | 100.0 /100 | #33 | Exceptional 7.9% |
| Native Hawaiians | 100.0 /100 | #34 | Exceptional 7.9% |
| Immigrants | South Central Asia | 100.0 /100 | #35 | Exceptional 7.9% |
| Burmese | 100.0 /100 | #36 | Exceptional 8.0% |
| Asians | 100.0 /100 | #37 | Exceptional 8.0% |