Somali vs British West Indian Unemployment Among Women with Children Under 6 years
COMPARE
Somali
British West Indian
Unemployment Among Women with Children Under 6 years
Unemployment Among Women with Children Under 6 years Comparison
Somalis
British West Indians
6.9%
UNEMPLOYMENT AMONG WOMEN WITH CHILDREN UNDER 6 YEARS
99.7/ 100
METRIC RATING
62nd/ 347
METRIC RANK
8.3%
UNEMPLOYMENT AMONG WOMEN WITH CHILDREN UNDER 6 YEARS
0.5/ 100
METRIC RATING
257th/ 347
METRIC RANK
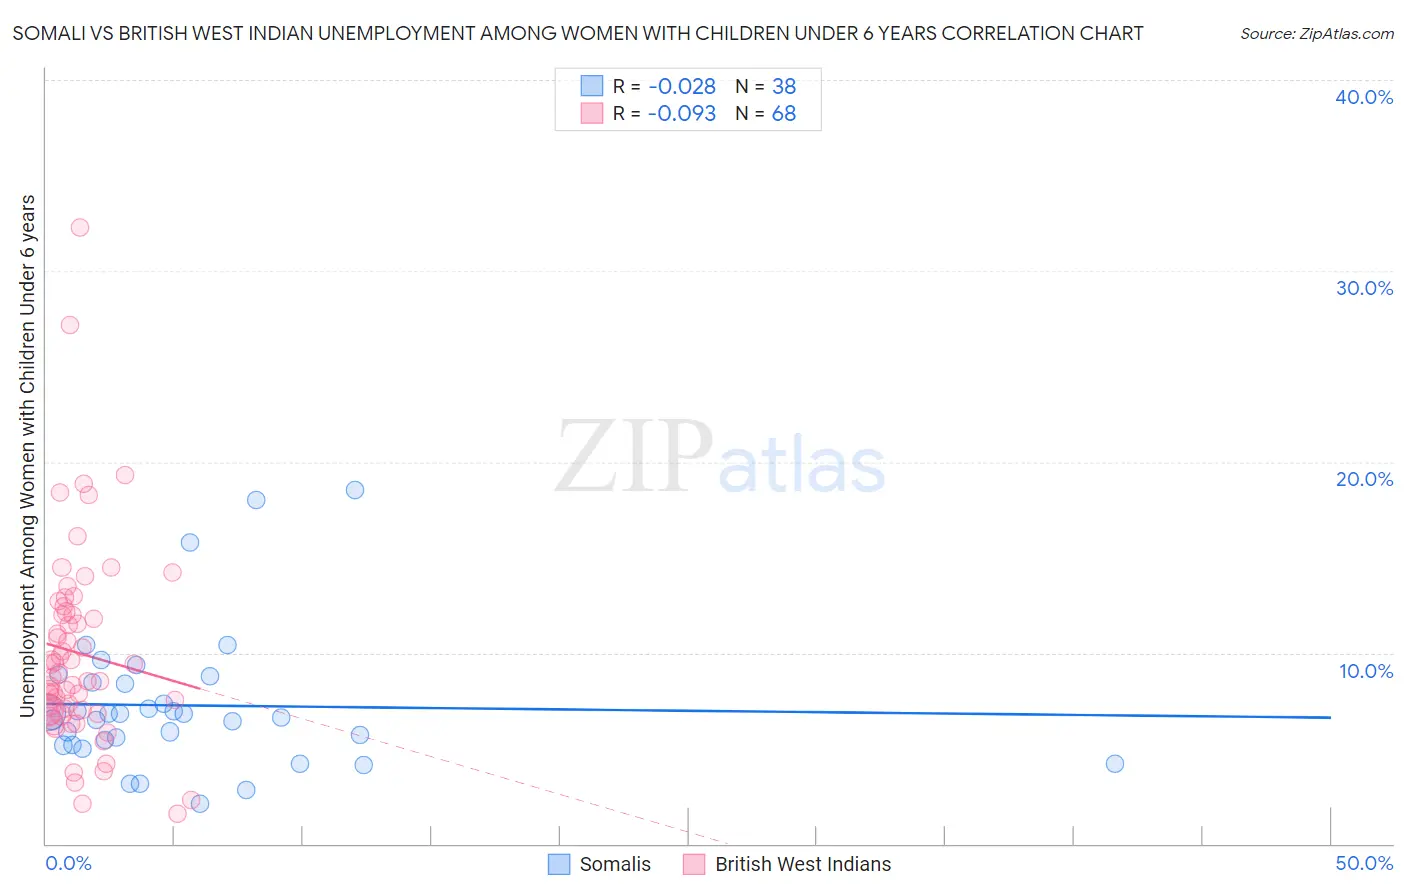
Somali vs British West Indian Unemployment Among Women with Children Under 6 years Correlation Chart
The statistical analysis conducted on geographies consisting of 89,780,147 people shows no correlation between the proportion of Somalis and unemployment rate among women with children under the age of 6 in the United States with a correlation coefficient (R) of -0.028 and weighted average of 6.9%. Similarly, the statistical analysis conducted on geographies consisting of 134,064,740 people shows a slight negative correlation between the proportion of British West Indians and unemployment rate among women with children under the age of 6 in the United States with a correlation coefficient (R) of -0.093 and weighted average of 8.3%, a difference of 20.4%.
Unemployment Among Women with Children Under 6 years Correlation Summary
| Measurement | Somali | British West Indian |
| Minimum | 2.1% | 1.6% |
| Maximum | 18.5% | 32.3% |
| Range | 16.4% | 30.7% |
| Mean | 7.2% | 10.0% |
| Median | 6.7% | 8.8% |
| Interquartile 25% (IQ1) | 5.2% | 7.0% |
| Interquartile 75% (IQ3) | 8.5% | 12.1% |
| Interquartile Range (IQR) | 3.3% | 5.1% |
| Standard Deviation (Sample) | 3.6% | 5.3% |
| Standard Deviation (Population) | 3.6% | 5.2% |
Similar Demographics by Unemployment Among Women with Children Under 6 years
Demographics Similar to Somalis by Unemployment Among Women with Children Under 6 years
In terms of unemployment among women with children under 6 years, the demographic groups most similar to Somalis are Immigrants from France (6.9%, a difference of 0.040%), Maltese (6.9%, a difference of 0.050%), Tongan (6.9%, a difference of 0.15%), Immigrants from Kuwait (6.9%, a difference of 0.29%), and Immigrants from Sri Lanka (6.9%, a difference of 0.41%).
| Demographics | Rating | Rank | Unemployment Among Women with Children Under 6 years |
| Immigrants | Ukraine | 99.8 /100 | #55 | Exceptional 6.8% |
| Immigrants | Ethiopia | 99.8 /100 | #56 | Exceptional 6.9% |
| Icelanders | 99.8 /100 | #57 | Exceptional 6.9% |
| Immigrants | Turkey | 99.8 /100 | #58 | Exceptional 6.9% |
| Immigrants | Serbia | 99.8 /100 | #59 | Exceptional 6.9% |
| Immigrants | Sri Lanka | 99.8 /100 | #60 | Exceptional 6.9% |
| Immigrants | France | 99.7 /100 | #61 | Exceptional 6.9% |
| Somalis | 99.7 /100 | #62 | Exceptional 6.9% |
| Maltese | 99.7 /100 | #63 | Exceptional 6.9% |
| Tongans | 99.7 /100 | #64 | Exceptional 6.9% |
| Immigrants | Kuwait | 99.7 /100 | #65 | Exceptional 6.9% |
| Immigrants | Belgium | 99.6 /100 | #66 | Exceptional 6.9% |
| Immigrants | Netherlands | 99.5 /100 | #67 | Exceptional 7.0% |
| Paraguayans | 99.4 /100 | #68 | Exceptional 7.0% |
| Immigrants | Eritrea | 99.4 /100 | #69 | Exceptional 7.0% |
Demographics Similar to British West Indians by Unemployment Among Women with Children Under 6 years
In terms of unemployment among women with children under 6 years, the demographic groups most similar to British West Indians are Immigrants from Ghana (8.3%, a difference of 0.020%), Celtic (8.3%, a difference of 0.26%), Immigrants from Portugal (8.3%, a difference of 0.27%), Barbadian (8.3%, a difference of 0.31%), and Immigrants from Caribbean (8.3%, a difference of 0.57%).
| Demographics | Rating | Rank | Unemployment Among Women with Children Under 6 years |
| Nigerians | 1.1 /100 | #250 | Tragic 8.2% |
| Guyanese | 1.0 /100 | #251 | Tragic 8.2% |
| Ghanaians | 1.0 /100 | #252 | Tragic 8.2% |
| Immigrants | Guyana | 0.8 /100 | #253 | Tragic 8.2% |
| Immigrants | Caribbean | 0.7 /100 | #254 | Tragic 8.3% |
| Immigrants | Portugal | 0.6 /100 | #255 | Tragic 8.3% |
| Celtics | 0.6 /100 | #256 | Tragic 8.3% |
| British West Indians | 0.5 /100 | #257 | Tragic 8.3% |
| Immigrants | Ghana | 0.5 /100 | #258 | Tragic 8.3% |
| Barbadians | 0.4 /100 | #259 | Tragic 8.3% |
| Whites/Caucasians | 0.3 /100 | #260 | Tragic 8.4% |
| Immigrants | Liberia | 0.3 /100 | #261 | Tragic 8.4% |
| West Indians | 0.3 /100 | #262 | Tragic 8.4% |
| Scotch-Irish | 0.3 /100 | #263 | Tragic 8.4% |
| Hondurans | 0.3 /100 | #264 | Tragic 8.4% |