Immigrants from Norway vs Australian Unemployment Among Seniors over 75 years
COMPARE
Immigrants from Norway
Australian
Unemployment Among Seniors over 75 years
Unemployment Among Seniors over 75 years Comparison
Immigrants from Norway
Australians
7.7%
UNEMPLOYMENT AMONG SENIORS OVER 75 YEARS
100.0/ 100
METRIC RATING
35th/ 347
METRIC RANK
8.7%
UNEMPLOYMENT AMONG SENIORS OVER 75 YEARS
50.3/ 100
METRIC RATING
173rd/ 347
METRIC RANK
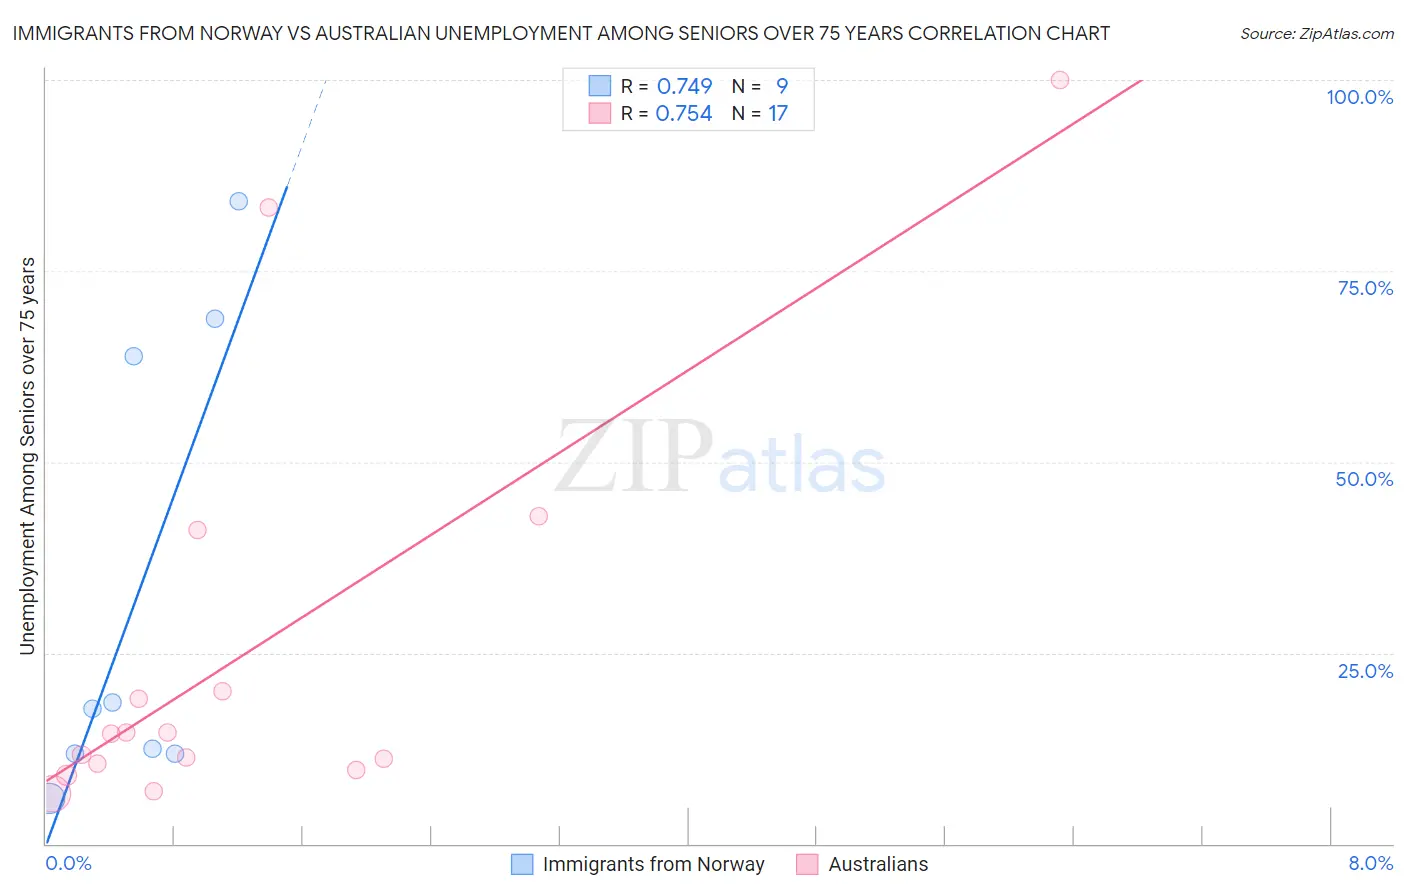
Immigrants from Norway vs Australian Unemployment Among Seniors over 75 years Correlation Chart
The statistical analysis conducted on geographies consisting of 86,216,399 people shows a strong positive correlation between the proportion of Immigrants from Norway and unemployment rate among seniors over the age of 75 in the United States with a correlation coefficient (R) of 0.749 and weighted average of 7.7%. Similarly, the statistical analysis conducted on geographies consisting of 140,674,086 people shows a strong positive correlation between the proportion of Australians and unemployment rate among seniors over the age of 75 in the United States with a correlation coefficient (R) of 0.754 and weighted average of 8.7%, a difference of 13.8%.
Unemployment Among Seniors over 75 years Correlation Summary
| Measurement | Immigrants from Norway | Australian |
| Minimum | 5.9% | 6.5% |
| Maximum | 84.2% | 100.0% |
| Range | 78.3% | 93.5% |
| Mean | 32.8% | 25.1% |
| Median | 17.7% | 14.4% |
| Interquartile 25% (IQ1) | 11.8% | 10.1% |
| Interquartile 75% (IQ3) | 66.3% | 30.6% |
| Interquartile Range (IQR) | 54.6% | 20.5% |
| Standard Deviation (Sample) | 30.3% | 27.3% |
| Standard Deviation (Population) | 28.6% | 26.5% |
Similar Demographics by Unemployment Among Seniors over 75 years
Demographics Similar to Immigrants from Norway by Unemployment Among Seniors over 75 years
In terms of unemployment among seniors over 75 years, the demographic groups most similar to Immigrants from Norway are Luxembourger (7.7%, a difference of 0.10%), Immigrants from Eritrea (7.7%, a difference of 0.21%), Immigrants from Hungary (7.7%, a difference of 0.30%), Kiowa (7.7%, a difference of 0.32%), and Ugandan (7.7%, a difference of 0.35%).
| Demographics | Rating | Rank | Unemployment Among Seniors over 75 years |
| Immigrants | Israel | 100.0 /100 | #28 | Exceptional 7.6% |
| Immigrants | Iran | 100.0 /100 | #29 | Exceptional 7.6% |
| Immigrants | Sweden | 100.0 /100 | #30 | Exceptional 7.6% |
| Guyanese | 100.0 /100 | #31 | Exceptional 7.6% |
| Immigrants | Hong Kong | 100.0 /100 | #32 | Exceptional 7.6% |
| Cambodians | 100.0 /100 | #33 | Exceptional 7.6% |
| Immigrants | Eritrea | 100.0 /100 | #34 | Exceptional 7.7% |
| Immigrants | Norway | 100.0 /100 | #35 | Exceptional 7.7% |
| Luxembourgers | 100.0 /100 | #36 | Exceptional 7.7% |
| Immigrants | Hungary | 100.0 /100 | #37 | Exceptional 7.7% |
| Kiowa | 100.0 /100 | #38 | Exceptional 7.7% |
| Ugandans | 100.0 /100 | #39 | Exceptional 7.7% |
| Colville | 100.0 /100 | #40 | Exceptional 7.7% |
| Immigrants | Burma/Myanmar | 100.0 /100 | #41 | Exceptional 7.7% |
| Pueblo | 100.0 /100 | #42 | Exceptional 7.7% |
Demographics Similar to Australians by Unemployment Among Seniors over 75 years
In terms of unemployment among seniors over 75 years, the demographic groups most similar to Australians are Immigrants from El Salvador (8.7%, a difference of 0.030%), Syrian (8.7%, a difference of 0.040%), Dominican (8.7%, a difference of 0.080%), Immigrants (8.7%, a difference of 0.080%), and Zimbabwean (8.7%, a difference of 0.20%).
| Demographics | Rating | Rank | Unemployment Among Seniors over 75 years |
| Immigrants | Belize | 57.6 /100 | #166 | Average 8.7% |
| Immigrants | Eastern Africa | 57.6 /100 | #167 | Average 8.7% |
| Immigrants | Lithuania | 57.2 /100 | #168 | Average 8.7% |
| Fijians | 56.4 /100 | #169 | Average 8.7% |
| Zimbabweans | 54.1 /100 | #170 | Average 8.7% |
| Dominicans | 51.9 /100 | #171 | Average 8.7% |
| Immigrants | Immigrants | 51.8 /100 | #172 | Average 8.7% |
| Australians | 50.3 /100 | #173 | Average 8.7% |
| Immigrants | El Salvador | 49.7 /100 | #174 | Average 8.7% |
| Syrians | 49.6 /100 | #175 | Average 8.7% |
| Somalis | 45.3 /100 | #176 | Average 8.8% |
| Central Americans | 43.3 /100 | #177 | Average 8.8% |
| West Indians | 41.9 /100 | #178 | Average 8.8% |
| Immigrants | Italy | 41.7 /100 | #179 | Average 8.8% |
| Immigrants | Somalia | 41.7 /100 | #180 | Average 8.8% |