Slovene vs South American Unemployment Among Ages 60 to 64 years
COMPARE
Slovene
South American
Unemployment Among Ages 60 to 64 years
Unemployment Among Ages 60 to 64 years Comparison
Slovenes
South Americans
4.4%
UNEMPLOYMENT AMONG AGES 60 TO 64 YEARS
100.0/ 100
METRIC RATING
18th/ 347
METRIC RANK
5.1%
UNEMPLOYMENT AMONG AGES 60 TO 64 YEARS
1.0/ 100
METRIC RATING
249th/ 347
METRIC RANK
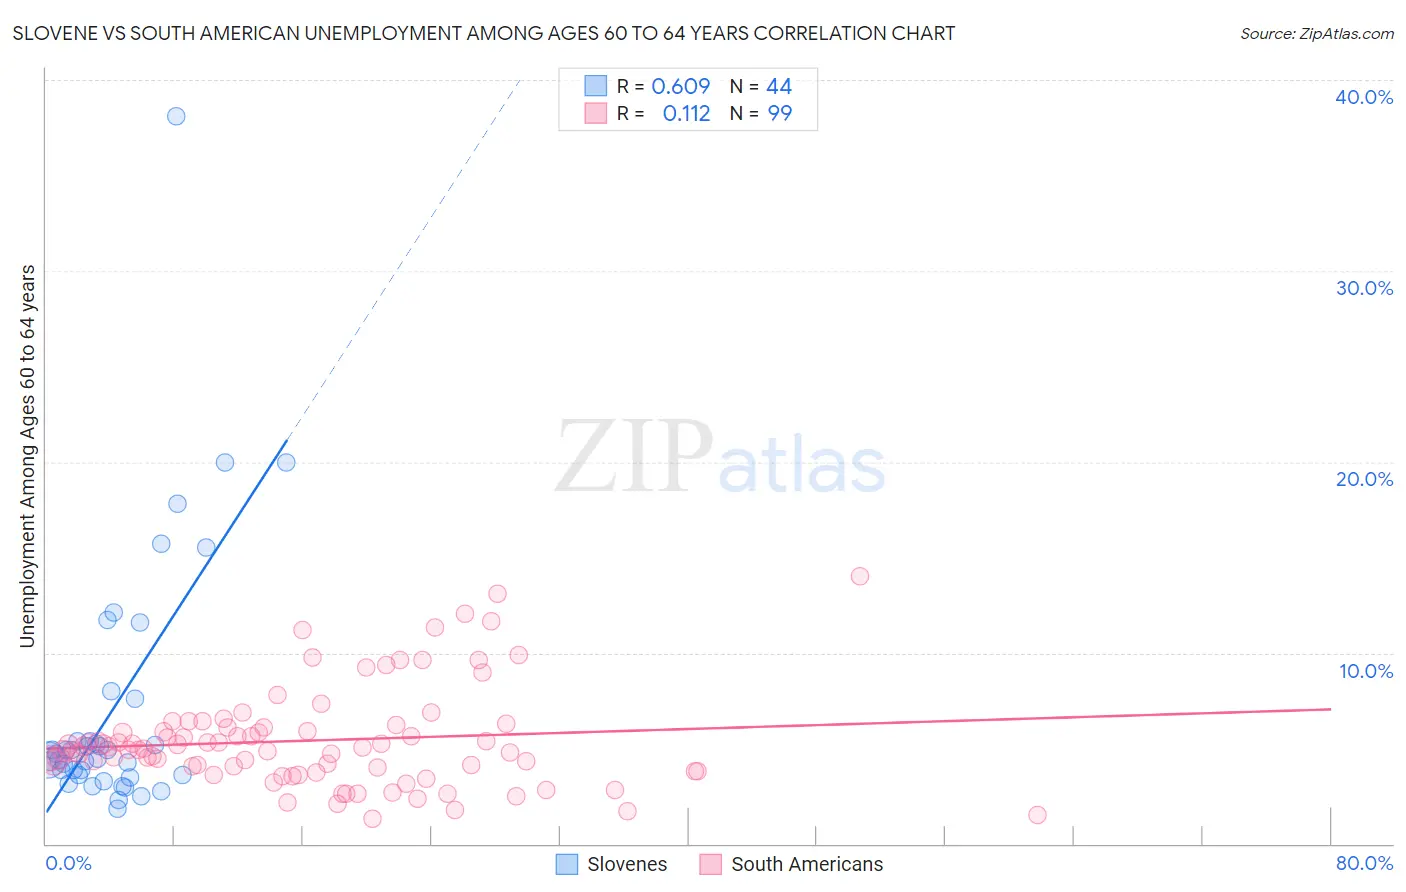
Slovene vs South American Unemployment Among Ages 60 to 64 years Correlation Chart
The statistical analysis conducted on geographies consisting of 241,955,713 people shows a significant positive correlation between the proportion of Slovenes and unemployment rate among population between the ages 60 and 64 in the United States with a correlation coefficient (R) of 0.609 and weighted average of 4.4%. Similarly, the statistical analysis conducted on geographies consisting of 432,918,226 people shows a poor positive correlation between the proportion of South Americans and unemployment rate among population between the ages 60 and 64 in the United States with a correlation coefficient (R) of 0.112 and weighted average of 5.1%, a difference of 15.2%.
Unemployment Among Ages 60 to 64 years Correlation Summary
| Measurement | Slovene | South American |
| Minimum | 1.8% | 1.3% |
| Maximum | 38.1% | 14.0% |
| Range | 36.3% | 12.7% |
| Mean | 7.1% | 5.4% |
| Median | 4.6% | 5.0% |
| Interquartile 25% (IQ1) | 3.6% | 3.8% |
| Interquartile 75% (IQ3) | 6.5% | 6.1% |
| Interquartile Range (IQR) | 2.9% | 2.3% |
| Standard Deviation (Sample) | 6.8% | 2.6% |
| Standard Deviation (Population) | 6.7% | 2.6% |
Similar Demographics by Unemployment Among Ages 60 to 64 years
Demographics Similar to Slovenes by Unemployment Among Ages 60 to 64 years
In terms of unemployment among ages 60 to 64 years, the demographic groups most similar to Slovenes are Tsimshian (4.4%, a difference of 0.11%), Afghan (4.4%, a difference of 0.25%), Immigrants from Cabo Verde (4.4%, a difference of 0.25%), Cape Verdean (4.4%, a difference of 0.33%), and Immigrants from Afghanistan (4.4%, a difference of 0.40%).
| Demographics | Rating | Rank | Unemployment Among Ages 60 to 64 years |
| Luxembourgers | 100.0 /100 | #11 | Exceptional 4.3% |
| Immigrants | Cuba | 100.0 /100 | #12 | Exceptional 4.3% |
| Chickasaw | 100.0 /100 | #13 | Exceptional 4.3% |
| Norwegians | 100.0 /100 | #14 | Exceptional 4.3% |
| Sudanese | 100.0 /100 | #15 | Exceptional 4.3% |
| Danes | 100.0 /100 | #16 | Exceptional 4.4% |
| Immigrants | Afghanistan | 100.0 /100 | #17 | Exceptional 4.4% |
| Slovenes | 100.0 /100 | #18 | Exceptional 4.4% |
| Tsimshian | 100.0 /100 | #19 | Exceptional 4.4% |
| Afghans | 100.0 /100 | #20 | Exceptional 4.4% |
| Immigrants | Cabo Verde | 100.0 /100 | #21 | Exceptional 4.4% |
| Cape Verdeans | 100.0 /100 | #22 | Exceptional 4.4% |
| Immigrants | Zaire | 100.0 /100 | #23 | Exceptional 4.4% |
| Immigrants | Burma/Myanmar | 100.0 /100 | #24 | Exceptional 4.4% |
| Yugoslavians | 100.0 /100 | #25 | Exceptional 4.4% |
Demographics Similar to South Americans by Unemployment Among Ages 60 to 64 years
In terms of unemployment among ages 60 to 64 years, the demographic groups most similar to South Americans are Immigrants from Fiji (5.1%, a difference of 0.030%), Immigrants from South America (5.0%, a difference of 0.080%), Immigrants from North Macedonia (5.0%, a difference of 0.080%), Immigrants from Cambodia (5.1%, a difference of 0.10%), and Immigrants from Uruguay (5.1%, a difference of 0.13%).
| Demographics | Rating | Rank | Unemployment Among Ages 60 to 64 years |
| Argentineans | 2.1 /100 | #242 | Tragic 5.0% |
| Immigrants | Philippines | 1.9 /100 | #243 | Tragic 5.0% |
| Peruvians | 1.6 /100 | #244 | Tragic 5.0% |
| Comanche | 1.3 /100 | #245 | Tragic 5.0% |
| Immigrants | South America | 1.1 /100 | #246 | Tragic 5.0% |
| Immigrants | North Macedonia | 1.1 /100 | #247 | Tragic 5.0% |
| Immigrants | Fiji | 1.1 /100 | #248 | Tragic 5.1% |
| South Americans | 1.0 /100 | #249 | Tragic 5.1% |
| Immigrants | Cambodia | 0.9 /100 | #250 | Tragic 5.1% |
| Immigrants | Uruguay | 0.9 /100 | #251 | Tragic 5.1% |
| Immigrants | Switzerland | 0.9 /100 | #252 | Tragic 5.1% |
| Immigrants | China | 0.9 /100 | #253 | Tragic 5.1% |
| Costa Ricans | 0.8 /100 | #254 | Tragic 5.1% |
| Estonians | 0.8 /100 | #255 | Tragic 5.1% |
| Immigrants | Peru | 0.7 /100 | #256 | Tragic 5.1% |