Slovene vs Lebanese Unemployment Among Ages 60 to 64 years
COMPARE
Slovene
Lebanese
Unemployment Among Ages 60 to 64 years
Unemployment Among Ages 60 to 64 years Comparison
Slovenes
Lebanese
4.4%
UNEMPLOYMENT AMONG AGES 60 TO 64 YEARS
100.0/ 100
METRIC RATING
18th/ 347
METRIC RANK
4.6%
UNEMPLOYMENT AMONG AGES 60 TO 64 YEARS
99.8/ 100
METRIC RATING
61st/ 347
METRIC RANK
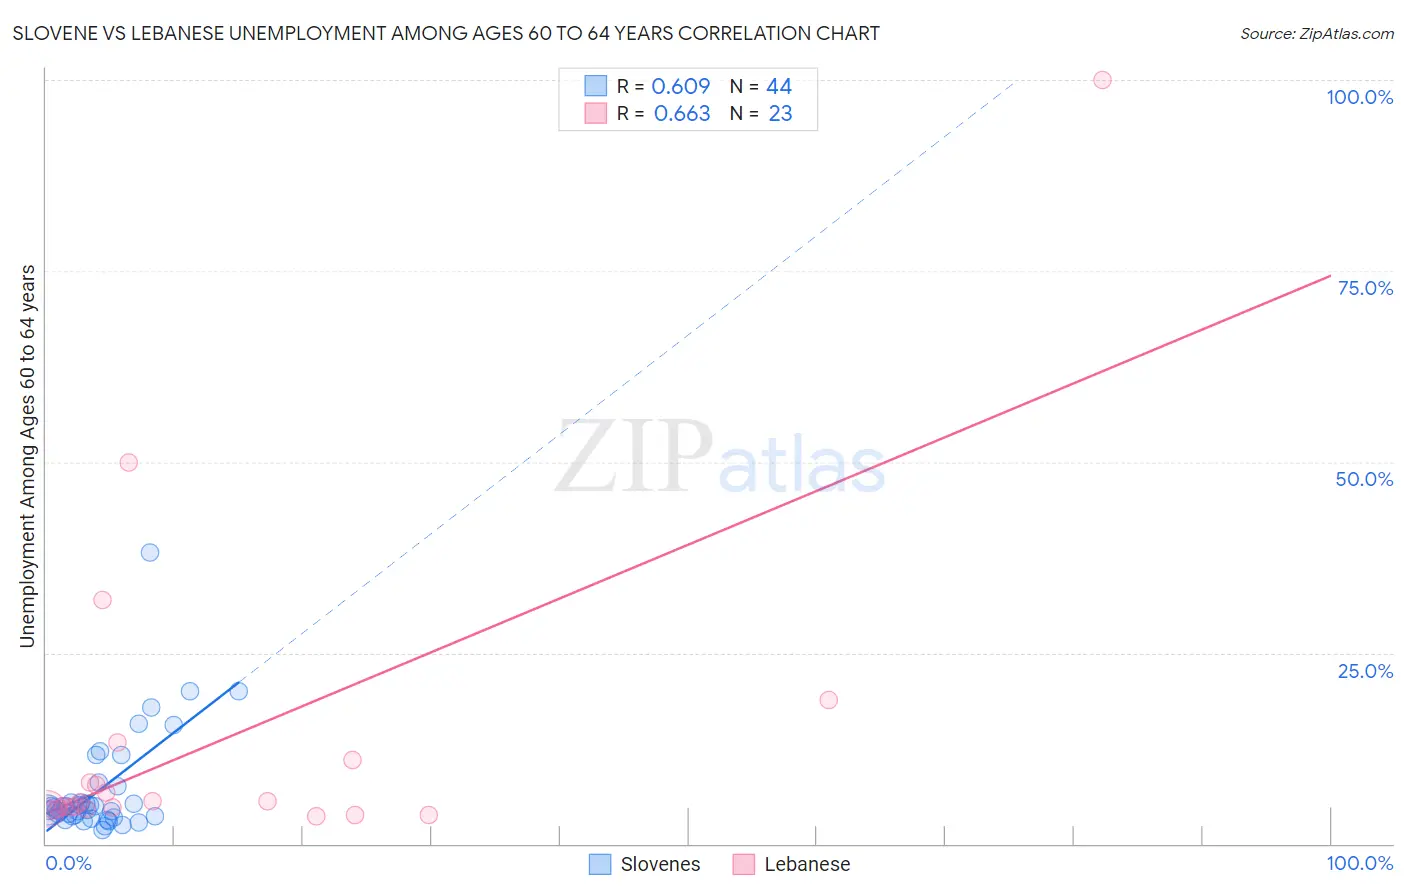
Slovene vs Lebanese Unemployment Among Ages 60 to 64 years Correlation Chart
The statistical analysis conducted on geographies consisting of 241,955,713 people shows a significant positive correlation between the proportion of Slovenes and unemployment rate among population between the ages 60 and 64 in the United States with a correlation coefficient (R) of 0.609 and weighted average of 4.4%. Similarly, the statistical analysis conducted on geographies consisting of 362,597,507 people shows a significant positive correlation between the proportion of Lebanese and unemployment rate among population between the ages 60 and 64 in the United States with a correlation coefficient (R) of 0.663 and weighted average of 4.6%, a difference of 4.9%.
Unemployment Among Ages 60 to 64 years Correlation Summary
| Measurement | Slovene | Lebanese |
| Minimum | 1.8% | 3.6% |
| Maximum | 38.1% | 100.0% |
| Range | 36.3% | 96.4% |
| Mean | 7.1% | 13.6% |
| Median | 4.6% | 5.4% |
| Interquartile 25% (IQ1) | 3.6% | 4.6% |
| Interquartile 75% (IQ3) | 6.5% | 10.9% |
| Interquartile Range (IQR) | 2.9% | 6.3% |
| Standard Deviation (Sample) | 6.8% | 21.7% |
| Standard Deviation (Population) | 6.7% | 21.3% |
Similar Demographics by Unemployment Among Ages 60 to 64 years
Demographics Similar to Slovenes by Unemployment Among Ages 60 to 64 years
In terms of unemployment among ages 60 to 64 years, the demographic groups most similar to Slovenes are Tsimshian (4.4%, a difference of 0.11%), Afghan (4.4%, a difference of 0.25%), Immigrants from Cabo Verde (4.4%, a difference of 0.25%), Cape Verdean (4.4%, a difference of 0.33%), and Immigrants from Afghanistan (4.4%, a difference of 0.40%).
| Demographics | Rating | Rank | Unemployment Among Ages 60 to 64 years |
| Luxembourgers | 100.0 /100 | #11 | Exceptional 4.3% |
| Immigrants | Cuba | 100.0 /100 | #12 | Exceptional 4.3% |
| Chickasaw | 100.0 /100 | #13 | Exceptional 4.3% |
| Norwegians | 100.0 /100 | #14 | Exceptional 4.3% |
| Sudanese | 100.0 /100 | #15 | Exceptional 4.3% |
| Danes | 100.0 /100 | #16 | Exceptional 4.4% |
| Immigrants | Afghanistan | 100.0 /100 | #17 | Exceptional 4.4% |
| Slovenes | 100.0 /100 | #18 | Exceptional 4.4% |
| Tsimshian | 100.0 /100 | #19 | Exceptional 4.4% |
| Afghans | 100.0 /100 | #20 | Exceptional 4.4% |
| Immigrants | Cabo Verde | 100.0 /100 | #21 | Exceptional 4.4% |
| Cape Verdeans | 100.0 /100 | #22 | Exceptional 4.4% |
| Immigrants | Zaire | 100.0 /100 | #23 | Exceptional 4.4% |
| Immigrants | Burma/Myanmar | 100.0 /100 | #24 | Exceptional 4.4% |
| Yugoslavians | 100.0 /100 | #25 | Exceptional 4.4% |
Demographics Similar to Lebanese by Unemployment Among Ages 60 to 64 years
In terms of unemployment among ages 60 to 64 years, the demographic groups most similar to Lebanese are Senegalese (4.6%, a difference of 0.10%), Czechoslovakian (4.6%, a difference of 0.13%), Immigrants from Middle Africa (4.6%, a difference of 0.15%), Jordanian (4.6%, a difference of 0.17%), and Puget Sound Salish (4.6%, a difference of 0.33%).
| Demographics | Rating | Rank | Unemployment Among Ages 60 to 64 years |
| Dutch | 99.9 /100 | #54 | Exceptional 4.6% |
| Bangladeshis | 99.9 /100 | #55 | Exceptional 4.6% |
| Welsh | 99.9 /100 | #56 | Exceptional 4.6% |
| British | 99.9 /100 | #57 | Exceptional 4.6% |
| Immigrants | India | 99.8 /100 | #58 | Exceptional 4.6% |
| Swiss | 99.8 /100 | #59 | Exceptional 4.6% |
| Puget Sound Salish | 99.8 /100 | #60 | Exceptional 4.6% |
| Lebanese | 99.8 /100 | #61 | Exceptional 4.6% |
| Senegalese | 99.7 /100 | #62 | Exceptional 4.6% |
| Czechoslovakians | 99.7 /100 | #63 | Exceptional 4.6% |
| Immigrants | Middle Africa | 99.7 /100 | #64 | Exceptional 4.6% |
| Jordanians | 99.7 /100 | #65 | Exceptional 4.6% |
| Hawaiians | 99.6 /100 | #66 | Exceptional 4.6% |
| Immigrants | Scotland | 99.6 /100 | #67 | Exceptional 4.6% |
| Immigrants | Laos | 99.6 /100 | #68 | Exceptional 4.6% |