Slovak vs Guatemalan Unemployment Among Seniors over 75 years
COMPARE
Slovak
Guatemalan
Unemployment Among Seniors over 75 years
Unemployment Among Seniors over 75 years Comparison
Slovaks
Guatemalans
10.4%
UNEMPLOYMENT AMONG SENIORS OVER 75 YEARS
0.0/ 100
METRIC RATING
326th/ 347
METRIC RANK
8.8%
UNEMPLOYMENT AMONG SENIORS OVER 75 YEARS
39.5/ 100
METRIC RATING
182nd/ 347
METRIC RANK
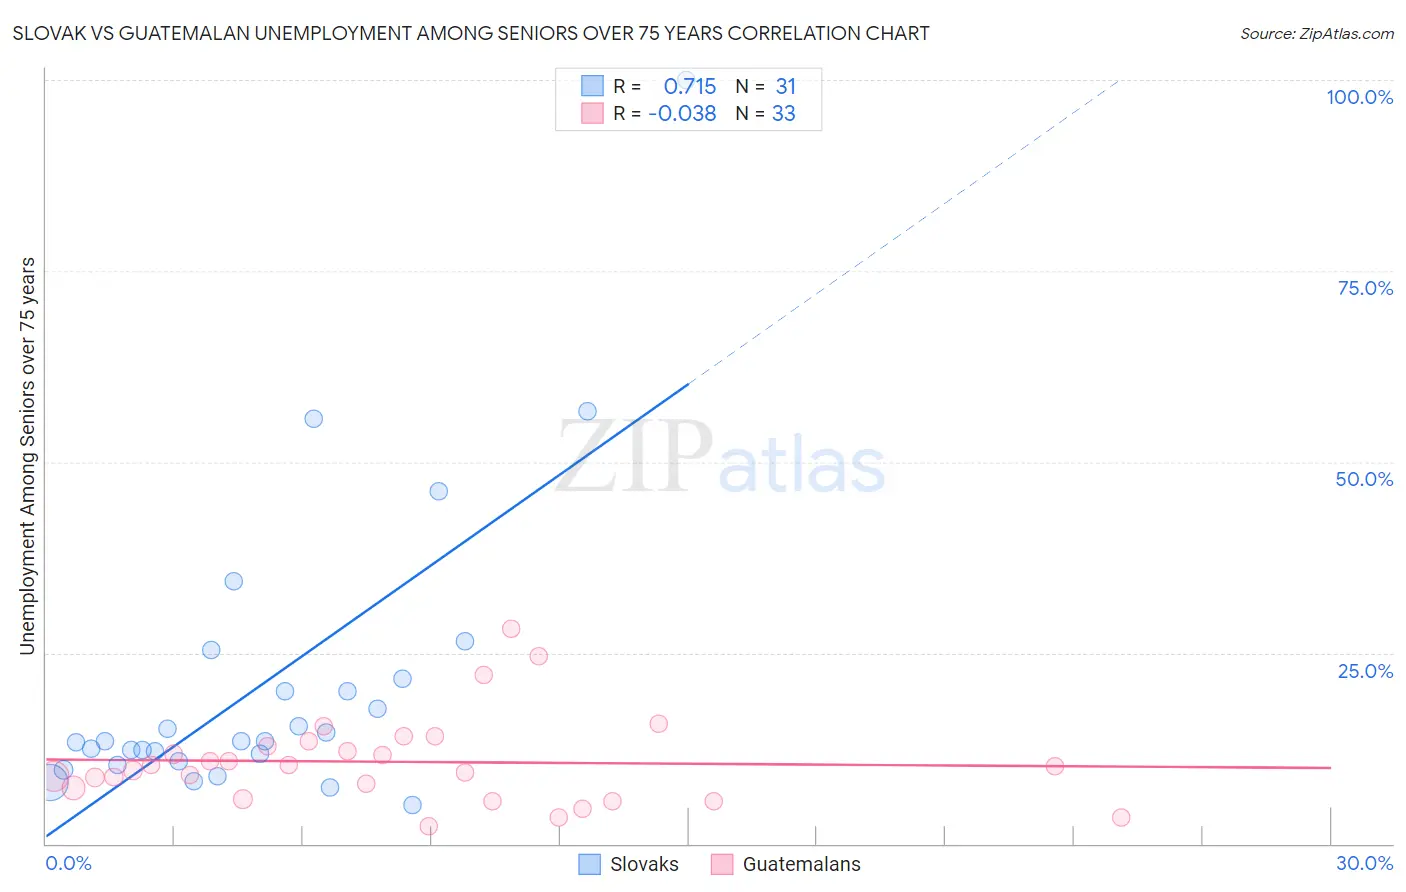
Slovak vs Guatemalan Unemployment Among Seniors over 75 years Correlation Chart
The statistical analysis conducted on geographies consisting of 198,086,533 people shows a strong positive correlation between the proportion of Slovaks and unemployment rate among seniors over the age of 75 in the United States with a correlation coefficient (R) of 0.715 and weighted average of 10.4%. Similarly, the statistical analysis conducted on geographies consisting of 204,244,700 people shows no correlation between the proportion of Guatemalans and unemployment rate among seniors over the age of 75 in the United States with a correlation coefficient (R) of -0.038 and weighted average of 8.8%, a difference of 18.5%.
Unemployment Among Seniors over 75 years Correlation Summary
| Measurement | Slovak | Guatemalan |
| Minimum | 5.0% | 2.3% |
| Maximum | 100.0% | 28.2% |
| Range | 95.0% | 25.9% |
| Mean | 21.0% | 10.7% |
| Median | 13.4% | 10.1% |
| Interquartile 25% (IQ1) | 10.8% | 6.6% |
| Interquartile 75% (IQ3) | 21.6% | 13.1% |
| Interquartile Range (IQR) | 10.8% | 6.5% |
| Standard Deviation (Sample) | 19.6% | 5.8% |
| Standard Deviation (Population) | 19.3% | 5.7% |
Similar Demographics by Unemployment Among Seniors over 75 years
Demographics Similar to Slovaks by Unemployment Among Seniors over 75 years
In terms of unemployment among seniors over 75 years, the demographic groups most similar to Slovaks are Dutch (10.4%, a difference of 0.080%), Portuguese (10.4%, a difference of 0.23%), American (10.4%, a difference of 0.43%), Tongan (10.4%, a difference of 0.46%), and Immigrants from Portugal (10.5%, a difference of 0.71%).
| Demographics | Rating | Rank | Unemployment Among Seniors over 75 years |
| Germans | 0.0 /100 | #319 | Tragic 10.3% |
| French | 0.0 /100 | #320 | Tragic 10.3% |
| Aleuts | 0.0 /100 | #321 | Tragic 10.3% |
| Poles | 0.0 /100 | #322 | Tragic 10.3% |
| Tongans | 0.0 /100 | #323 | Tragic 10.4% |
| Americans | 0.0 /100 | #324 | Tragic 10.4% |
| Portuguese | 0.0 /100 | #325 | Tragic 10.4% |
| Slovaks | 0.0 /100 | #326 | Tragic 10.4% |
| Dutch | 0.0 /100 | #327 | Tragic 10.4% |
| Immigrants | Portugal | 0.0 /100 | #328 | Tragic 10.5% |
| Tsimshian | 0.0 /100 | #329 | Tragic 10.5% |
| Immigrants | Azores | 0.0 /100 | #330 | Tragic 10.7% |
| Tohono O'odham | 0.0 /100 | #331 | Tragic 10.8% |
| Immigrants | Liberia | 0.0 /100 | #332 | Tragic 10.9% |
| Alaskan Athabascans | 0.0 /100 | #333 | Tragic 11.0% |
Demographics Similar to Guatemalans by Unemployment Among Seniors over 75 years
In terms of unemployment among seniors over 75 years, the demographic groups most similar to Guatemalans are Immigrants from Thailand (8.8%, a difference of 0.040%), Immigrants from Afghanistan (8.8%, a difference of 0.070%), Immigrants from Italy (8.8%, a difference of 0.12%), Immigrants from Somalia (8.8%, a difference of 0.12%), and West Indian (8.8%, a difference of 0.13%).
| Demographics | Rating | Rank | Unemployment Among Seniors over 75 years |
| Syrians | 49.6 /100 | #175 | Average 8.7% |
| Somalis | 45.3 /100 | #176 | Average 8.8% |
| Central Americans | 43.3 /100 | #177 | Average 8.8% |
| West Indians | 41.9 /100 | #178 | Average 8.8% |
| Immigrants | Italy | 41.7 /100 | #179 | Average 8.8% |
| Immigrants | Somalia | 41.7 /100 | #180 | Average 8.8% |
| Immigrants | Thailand | 40.2 /100 | #181 | Average 8.8% |
| Guatemalans | 39.5 /100 | #182 | Fair 8.8% |
| Immigrants | Afghanistan | 38.2 /100 | #183 | Fair 8.8% |
| Immigrants | Micronesia | 37.2 /100 | #184 | Fair 8.8% |
| Choctaw | 37.1 /100 | #185 | Fair 8.8% |
| Immigrants | Ethiopia | 36.2 /100 | #186 | Fair 8.8% |
| Immigrants | Europe | 35.2 /100 | #187 | Fair 8.8% |
| Immigrants | Eastern Europe | 34.7 /100 | #188 | Fair 8.8% |
| Immigrants | Haiti | 34.7 /100 | #189 | Fair 8.8% |