Slovak vs Immigrants from Central America Unemployment Among Seniors over 75 years
COMPARE
Slovak
Immigrants from Central America
Unemployment Among Seniors over 75 years
Unemployment Among Seniors over 75 years Comparison
Slovaks
Immigrants from Central America
10.4%
UNEMPLOYMENT AMONG SENIORS OVER 75 YEARS
0.0/ 100
METRIC RATING
326th/ 347
METRIC RANK
9.1%
UNEMPLOYMENT AMONG SENIORS OVER 75 YEARS
4.9/ 100
METRIC RATING
231st/ 347
METRIC RANK
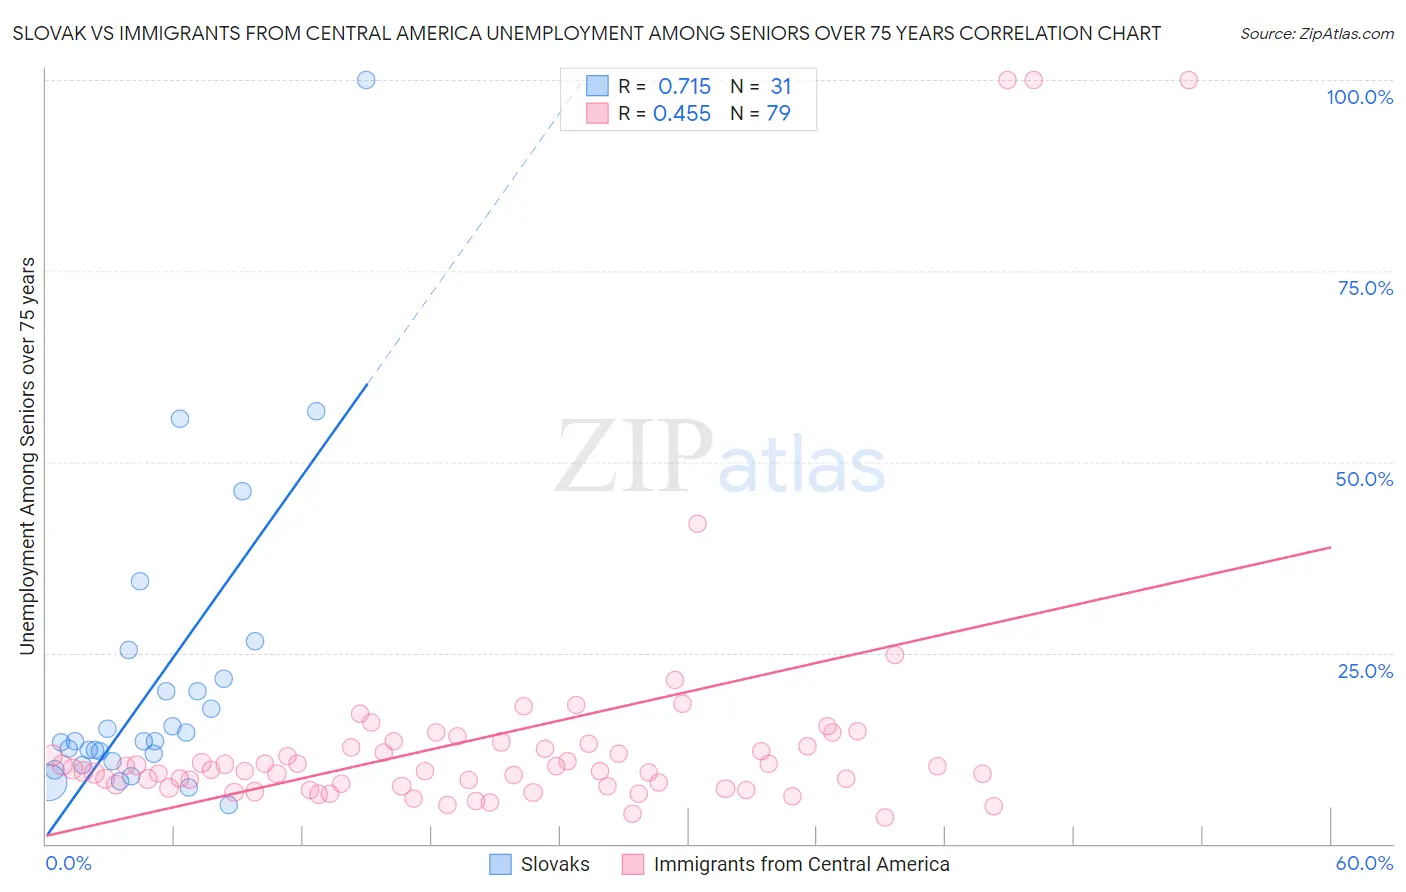
Slovak vs Immigrants from Central America Unemployment Among Seniors over 75 years Correlation Chart
The statistical analysis conducted on geographies consisting of 198,086,533 people shows a strong positive correlation between the proportion of Slovaks and unemployment rate among seniors over the age of 75 in the United States with a correlation coefficient (R) of 0.715 and weighted average of 10.4%. Similarly, the statistical analysis conducted on geographies consisting of 230,675,410 people shows a moderate positive correlation between the proportion of Immigrants from Central America and unemployment rate among seniors over the age of 75 in the United States with a correlation coefficient (R) of 0.455 and weighted average of 9.1%, a difference of 14.7%.
Unemployment Among Seniors over 75 years Correlation Summary
| Measurement | Slovak | Immigrants from Central America |
| Minimum | 5.0% | 3.5% |
| Maximum | 100.0% | 100.0% |
| Range | 95.0% | 96.5% |
| Mean | 21.0% | 14.1% |
| Median | 13.4% | 9.6% |
| Interquartile 25% (IQ1) | 10.8% | 7.6% |
| Interquartile 75% (IQ3) | 21.6% | 12.8% |
| Interquartile Range (IQR) | 10.8% | 5.2% |
| Standard Deviation (Sample) | 19.6% | 18.0% |
| Standard Deviation (Population) | 19.3% | 17.8% |
Similar Demographics by Unemployment Among Seniors over 75 years
Demographics Similar to Slovaks by Unemployment Among Seniors over 75 years
In terms of unemployment among seniors over 75 years, the demographic groups most similar to Slovaks are Dutch (10.4%, a difference of 0.080%), Portuguese (10.4%, a difference of 0.23%), American (10.4%, a difference of 0.43%), Tongan (10.4%, a difference of 0.46%), and Immigrants from Portugal (10.5%, a difference of 0.71%).
| Demographics | Rating | Rank | Unemployment Among Seniors over 75 years |
| Germans | 0.0 /100 | #319 | Tragic 10.3% |
| French | 0.0 /100 | #320 | Tragic 10.3% |
| Aleuts | 0.0 /100 | #321 | Tragic 10.3% |
| Poles | 0.0 /100 | #322 | Tragic 10.3% |
| Tongans | 0.0 /100 | #323 | Tragic 10.4% |
| Americans | 0.0 /100 | #324 | Tragic 10.4% |
| Portuguese | 0.0 /100 | #325 | Tragic 10.4% |
| Slovaks | 0.0 /100 | #326 | Tragic 10.4% |
| Dutch | 0.0 /100 | #327 | Tragic 10.4% |
| Immigrants | Portugal | 0.0 /100 | #328 | Tragic 10.5% |
| Tsimshian | 0.0 /100 | #329 | Tragic 10.5% |
| Immigrants | Azores | 0.0 /100 | #330 | Tragic 10.7% |
| Tohono O'odham | 0.0 /100 | #331 | Tragic 10.8% |
| Immigrants | Liberia | 0.0 /100 | #332 | Tragic 10.9% |
| Alaskan Athabascans | 0.0 /100 | #333 | Tragic 11.0% |
Demographics Similar to Immigrants from Central America by Unemployment Among Seniors over 75 years
In terms of unemployment among seniors over 75 years, the demographic groups most similar to Immigrants from Central America are Northern European (9.1%, a difference of 0.0%), Hispanic or Latino (9.1%, a difference of 0.010%), African (9.1%, a difference of 0.020%), Yugoslavian (9.1%, a difference of 0.040%), and Vietnamese (9.1%, a difference of 0.090%).
| Demographics | Rating | Rank | Unemployment Among Seniors over 75 years |
| Costa Ricans | 6.3 /100 | #224 | Tragic 9.1% |
| Navajo | 6.1 /100 | #225 | Tragic 9.1% |
| Immigrants | Bangladesh | 5.9 /100 | #226 | Tragic 9.1% |
| Samoans | 5.7 /100 | #227 | Tragic 9.1% |
| Kenyans | 5.4 /100 | #228 | Tragic 9.1% |
| Hispanics or Latinos | 5.0 /100 | #229 | Tragic 9.1% |
| Northern Europeans | 4.9 /100 | #230 | Tragic 9.1% |
| Immigrants | Central America | 4.9 /100 | #231 | Tragic 9.1% |
| Africans | 4.9 /100 | #232 | Tragic 9.1% |
| Yugoslavians | 4.8 /100 | #233 | Tragic 9.1% |
| Vietnamese | 4.6 /100 | #234 | Tragic 9.1% |
| Panamanians | 4.0 /100 | #235 | Tragic 9.1% |
| Jordanians | 4.0 /100 | #236 | Tragic 9.1% |
| Houma | 3.9 /100 | #237 | Tragic 9.1% |
| Inupiat | 3.6 /100 | #238 | Tragic 9.1% |