Slavic vs Menominee Unemployment Among Ages 55 to 59 years
COMPARE
Slavic
Menominee
Unemployment Among Ages 55 to 59 years
Unemployment Among Ages 55 to 59 years Comparison
Slavs
Menominee
4.7%
UNEMPLOYMENT AMONG AGES 55 TO 59 YEARS
83.7/ 100
METRIC RATING
135th/ 347
METRIC RANK
10.5%
UNEMPLOYMENT AMONG AGES 55 TO 59 YEARS
0.0/ 100
METRIC RATING
346th/ 347
METRIC RANK
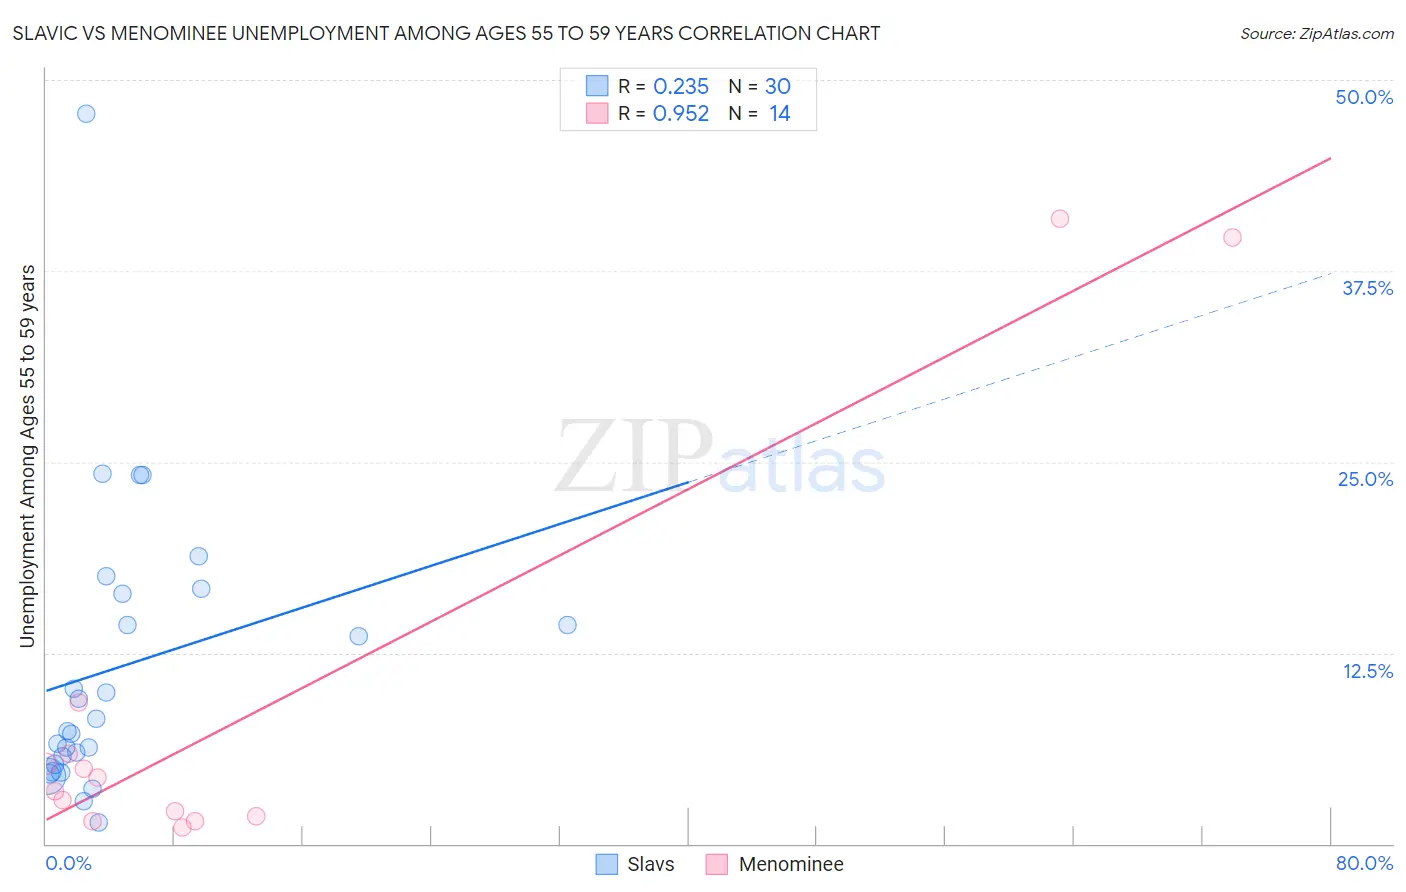
Slavic vs Menominee Unemployment Among Ages 55 to 59 years Correlation Chart
The statistical analysis conducted on geographies consisting of 256,539,964 people shows a weak positive correlation between the proportion of Slavs and unemployment rate among population between the ages 55 and 59 in the United States with a correlation coefficient (R) of 0.235 and weighted average of 4.7%. Similarly, the statistical analysis conducted on geographies consisting of 44,393,240 people shows a perfect positive correlation between the proportion of Menominee and unemployment rate among population between the ages 55 and 59 in the United States with a correlation coefficient (R) of 0.952 and weighted average of 10.5%, a difference of 122.4%.
Unemployment Among Ages 55 to 59 years Correlation Summary
| Measurement | Slavic | Menominee |
| Minimum | 1.4% | 1.1% |
| Maximum | 47.8% | 40.9% |
| Range | 46.4% | 39.8% |
| Mean | 11.5% | 8.9% |
| Median | 7.8% | 3.9% |
| Interquartile 25% (IQ1) | 5.2% | 1.8% |
| Interquartile 75% (IQ3) | 16.4% | 5.9% |
| Interquartile Range (IQR) | 11.2% | 4.1% |
| Standard Deviation (Sample) | 9.5% | 13.5% |
| Standard Deviation (Population) | 9.4% | 13.0% |
Similar Demographics by Unemployment Among Ages 55 to 59 years
Demographics Similar to Slavs by Unemployment Among Ages 55 to 59 years
In terms of unemployment among ages 55 to 59 years, the demographic groups most similar to Slavs are Colombian (4.7%, a difference of 0.010%), Delaware (4.7%, a difference of 0.010%), Panamanian (4.7%, a difference of 0.030%), Immigrants from Netherlands (4.7%, a difference of 0.060%), and Immigrants from Switzerland (4.7%, a difference of 0.060%).
| Demographics | Rating | Rank | Unemployment Among Ages 55 to 59 years |
| Pennsylvania Germans | 87.1 /100 | #128 | Excellent 4.7% |
| Immigrants | Sweden | 86.8 /100 | #129 | Excellent 4.7% |
| Greeks | 86.6 /100 | #130 | Excellent 4.7% |
| Immigrants | Thailand | 85.4 /100 | #131 | Excellent 4.7% |
| Immigrants | Romania | 85.3 /100 | #132 | Excellent 4.7% |
| Immigrants | Netherlands | 84.5 /100 | #133 | Excellent 4.7% |
| Panamanians | 84.1 /100 | #134 | Excellent 4.7% |
| Slavs | 83.7 /100 | #135 | Excellent 4.7% |
| Colombians | 83.6 /100 | #136 | Excellent 4.7% |
| Delaware | 83.6 /100 | #137 | Excellent 4.7% |
| Immigrants | Switzerland | 82.9 /100 | #138 | Excellent 4.7% |
| Romanians | 82.7 /100 | #139 | Excellent 4.7% |
| Immigrants | Indonesia | 80.2 /100 | #140 | Excellent 4.8% |
| French Canadians | 80.1 /100 | #141 | Excellent 4.8% |
| Immigrants | Norway | 79.8 /100 | #142 | Good 4.8% |
Demographics Similar to Menominee by Unemployment Among Ages 55 to 59 years
In terms of unemployment among ages 55 to 59 years, the demographic groups most similar to Menominee are Tohono O'odham (9.3%, a difference of 13.1%), Inupiat (9.0%, a difference of 16.6%), Yakama (8.9%, a difference of 18.0%), Hopi (8.1%, a difference of 29.8%), and Yup'ik (13.9%, a difference of 32.2%).
| Demographics | Rating | Rank | Unemployment Among Ages 55 to 59 years |
| Pima | 0.0 /100 | #333 | Tragic 6.6% |
| Pueblo | 0.0 /100 | #334 | Tragic 6.7% |
| Colville | 0.0 /100 | #335 | Tragic 6.7% |
| Navajo | 0.0 /100 | #336 | Tragic 6.7% |
| Paiute | 0.0 /100 | #337 | Tragic 6.8% |
| Immigrants | Yemen | 0.0 /100 | #338 | Tragic 6.9% |
| Puerto Ricans | 0.0 /100 | #339 | Tragic 7.0% |
| Alaskan Athabascans | 0.0 /100 | #340 | Tragic 7.1% |
| Shoshone | 0.0 /100 | #341 | Tragic 7.4% |
| Hopi | 0.0 /100 | #342 | Tragic 8.1% |
| Yakama | 0.0 /100 | #343 | Tragic 8.9% |
| Inupiat | 0.0 /100 | #344 | Tragic 9.0% |
| Tohono O'odham | 0.0 /100 | #345 | Tragic 9.3% |
| Menominee | 0.0 /100 | #346 | Tragic 10.5% |
| Yup'ik | 0.0 /100 | #347 | Tragic 13.9% |