Korean vs Menominee Unemployment Among Ages 55 to 59 years
COMPARE
Korean
Menominee
Unemployment Among Ages 55 to 59 years
Unemployment Among Ages 55 to 59 years Comparison
Koreans
Menominee
4.8%
UNEMPLOYMENT AMONG AGES 55 TO 59 YEARS
64.6/ 100
METRIC RATING
161st/ 347
METRIC RANK
10.5%
UNEMPLOYMENT AMONG AGES 55 TO 59 YEARS
0.0/ 100
METRIC RATING
346th/ 347
METRIC RANK
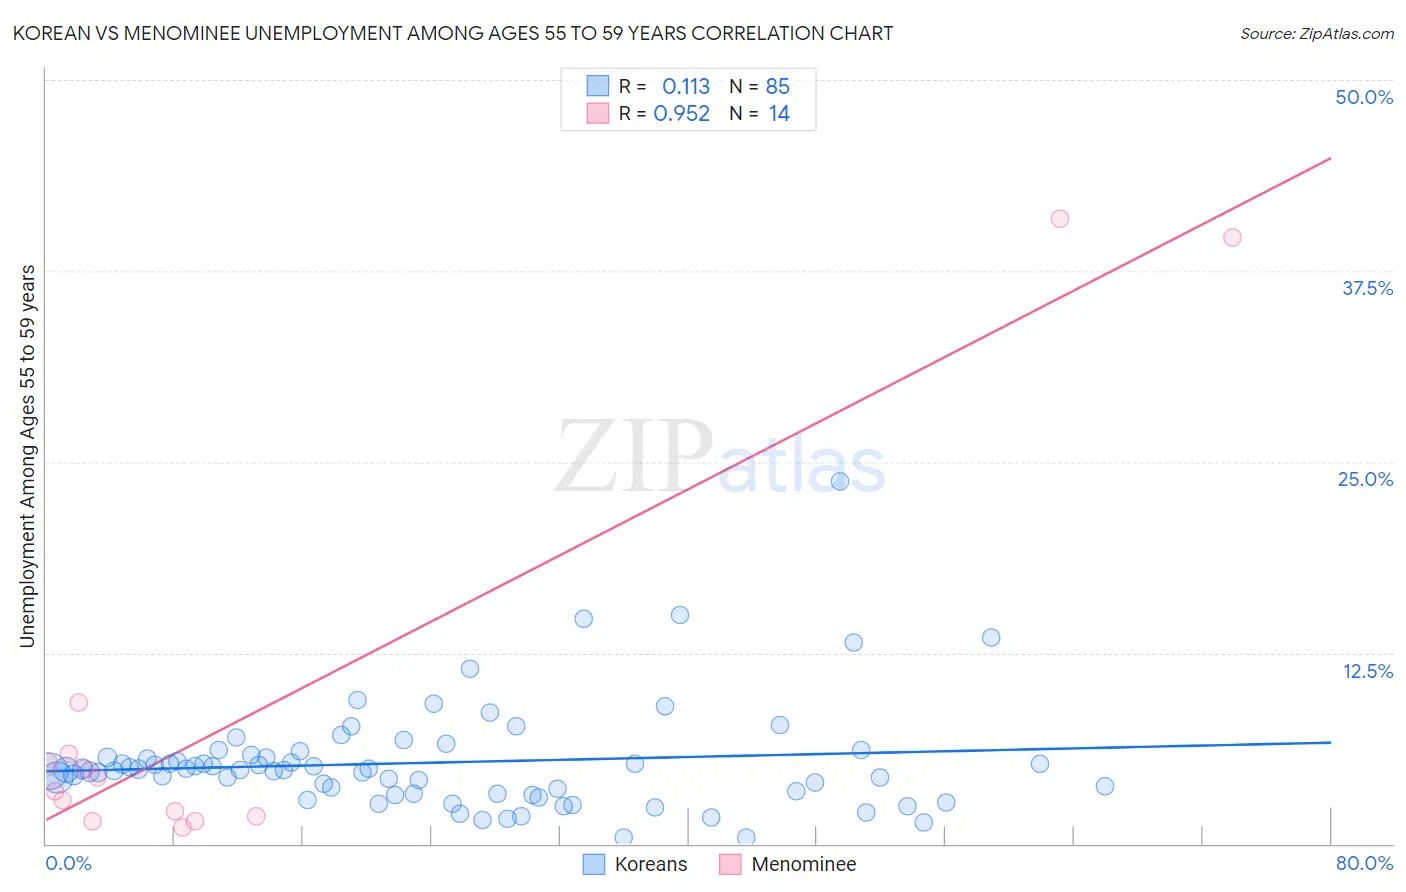
Korean vs Menominee Unemployment Among Ages 55 to 59 years Correlation Chart
The statistical analysis conducted on geographies consisting of 457,300,893 people shows a poor positive correlation between the proportion of Koreans and unemployment rate among population between the ages 55 and 59 in the United States with a correlation coefficient (R) of 0.113 and weighted average of 4.8%. Similarly, the statistical analysis conducted on geographies consisting of 44,393,240 people shows a perfect positive correlation between the proportion of Menominee and unemployment rate among population between the ages 55 and 59 in the United States with a correlation coefficient (R) of 0.952 and weighted average of 10.5%, a difference of 120.1%.
Unemployment Among Ages 55 to 59 years Correlation Summary
| Measurement | Korean | Menominee |
| Minimum | 0.40% | 1.1% |
| Maximum | 23.7% | 40.9% |
| Range | 23.3% | 39.8% |
| Mean | 5.3% | 8.9% |
| Median | 4.8% | 3.9% |
| Interquartile 25% (IQ1) | 3.3% | 1.8% |
| Interquartile 75% (IQ3) | 5.7% | 5.9% |
| Interquartile Range (IQR) | 2.5% | 4.1% |
| Standard Deviation (Sample) | 3.5% | 13.5% |
| Standard Deviation (Population) | 3.5% | 13.0% |
Similar Demographics by Unemployment Among Ages 55 to 59 years
Demographics Similar to Koreans by Unemployment Among Ages 55 to 59 years
In terms of unemployment among ages 55 to 59 years, the demographic groups most similar to Koreans are Chickasaw (4.8%, a difference of 0.020%), Immigrants from Africa (4.8%, a difference of 0.020%), Slovak (4.8%, a difference of 0.030%), Immigrants from Nicaragua (4.8%, a difference of 0.030%), and Immigrants from Lebanon (4.8%, a difference of 0.030%).
| Demographics | Rating | Rank | Unemployment Among Ages 55 to 59 years |
| Immigrants | Panama | 66.8 /100 | #154 | Good 4.8% |
| Immigrants | North Macedonia | 66.3 /100 | #155 | Good 4.8% |
| Italians | 66.2 /100 | #156 | Good 4.8% |
| Carpatho Rusyns | 66.0 /100 | #157 | Good 4.8% |
| Slovaks | 65.3 /100 | #158 | Good 4.8% |
| Immigrants | Nicaragua | 65.2 /100 | #159 | Good 4.8% |
| Chickasaw | 65.1 /100 | #160 | Good 4.8% |
| Koreans | 64.6 /100 | #161 | Good 4.8% |
| Immigrants | Africa | 64.2 /100 | #162 | Good 4.8% |
| Immigrants | Lebanon | 63.8 /100 | #163 | Good 4.8% |
| Americans | 63.3 /100 | #164 | Good 4.8% |
| Immigrants | France | 62.0 /100 | #165 | Good 4.8% |
| Potawatomi | 62.0 /100 | #166 | Good 4.8% |
| Immigrants | Western Europe | 60.4 /100 | #167 | Good 4.8% |
| Immigrants | Cambodia | 59.3 /100 | #168 | Average 4.8% |
Demographics Similar to Menominee by Unemployment Among Ages 55 to 59 years
In terms of unemployment among ages 55 to 59 years, the demographic groups most similar to Menominee are Tohono O'odham (9.3%, a difference of 13.1%), Inupiat (9.0%, a difference of 16.6%), Yakama (8.9%, a difference of 18.0%), Hopi (8.1%, a difference of 29.8%), and Yup'ik (13.9%, a difference of 32.2%).
| Demographics | Rating | Rank | Unemployment Among Ages 55 to 59 years |
| Pima | 0.0 /100 | #333 | Tragic 6.6% |
| Pueblo | 0.0 /100 | #334 | Tragic 6.7% |
| Colville | 0.0 /100 | #335 | Tragic 6.7% |
| Navajo | 0.0 /100 | #336 | Tragic 6.7% |
| Paiute | 0.0 /100 | #337 | Tragic 6.8% |
| Immigrants | Yemen | 0.0 /100 | #338 | Tragic 6.9% |
| Puerto Ricans | 0.0 /100 | #339 | Tragic 7.0% |
| Alaskan Athabascans | 0.0 /100 | #340 | Tragic 7.1% |
| Shoshone | 0.0 /100 | #341 | Tragic 7.4% |
| Hopi | 0.0 /100 | #342 | Tragic 8.1% |
| Yakama | 0.0 /100 | #343 | Tragic 8.9% |
| Inupiat | 0.0 /100 | #344 | Tragic 9.0% |
| Tohono O'odham | 0.0 /100 | #345 | Tragic 9.3% |
| Menominee | 0.0 /100 | #346 | Tragic 10.5% |
| Yup'ik | 0.0 /100 | #347 | Tragic 13.9% |