Slavic vs Immigrants from Honduras Unemployment Among Ages 55 to 59 years
COMPARE
Slavic
Immigrants from Honduras
Unemployment Among Ages 55 to 59 years
Unemployment Among Ages 55 to 59 years Comparison
Slavs
Immigrants from Honduras
4.7%
UNEMPLOYMENT AMONG AGES 55 TO 59 YEARS
83.7/ 100
METRIC RATING
135th/ 347
METRIC RANK
5.1%
UNEMPLOYMENT AMONG AGES 55 TO 59 YEARS
0.5/ 100
METRIC RATING
247th/ 347
METRIC RANK
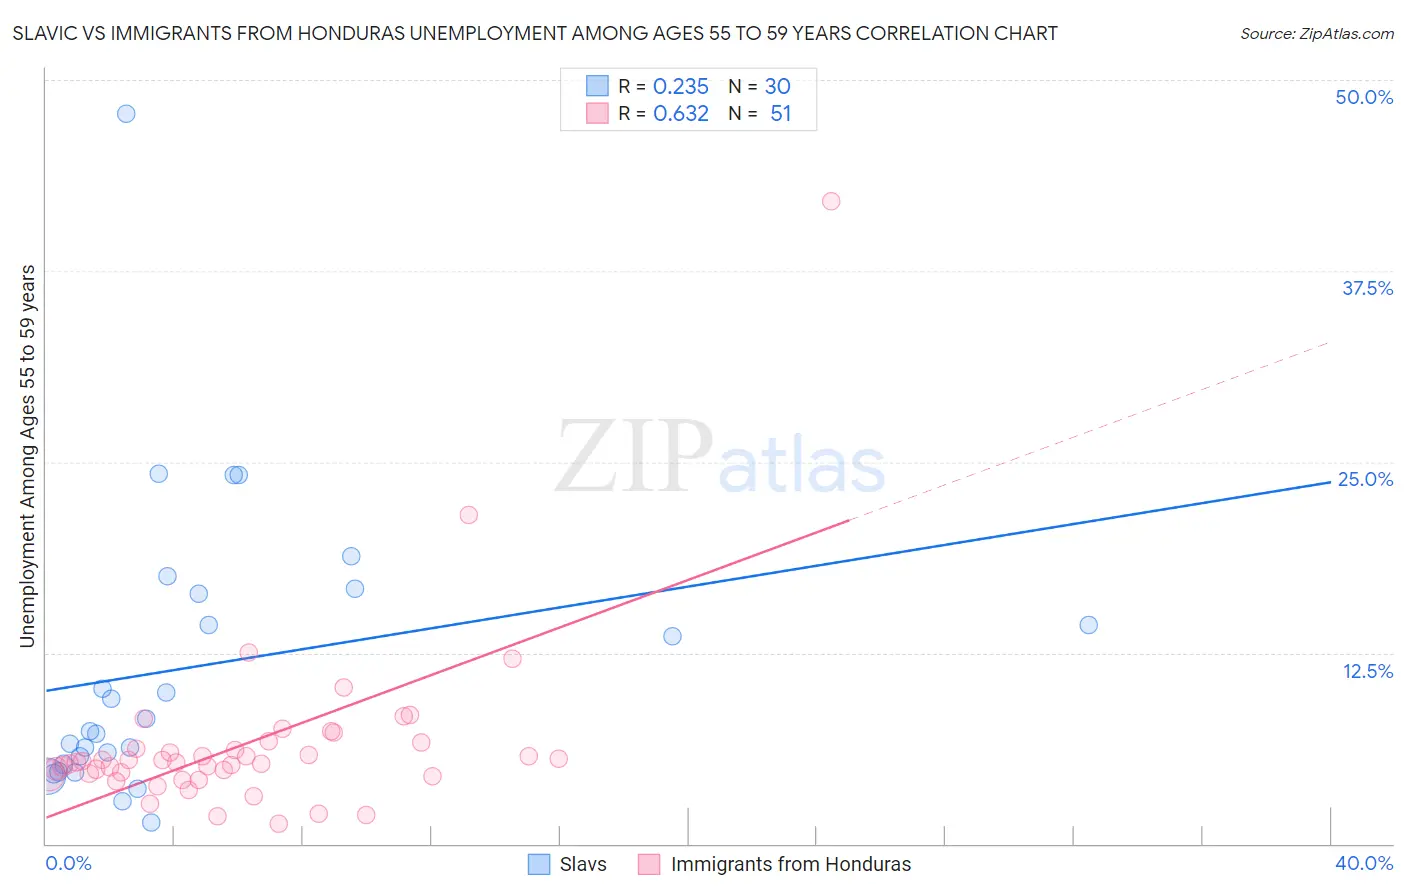
Slavic vs Immigrants from Honduras Unemployment Among Ages 55 to 59 years Correlation Chart
The statistical analysis conducted on geographies consisting of 256,539,964 people shows a weak positive correlation between the proportion of Slavs and unemployment rate among population between the ages 55 and 59 in the United States with a correlation coefficient (R) of 0.235 and weighted average of 4.7%. Similarly, the statistical analysis conducted on geographies consisting of 303,249,968 people shows a significant positive correlation between the proportion of Immigrants from Honduras and unemployment rate among population between the ages 55 and 59 in the United States with a correlation coefficient (R) of 0.632 and weighted average of 5.1%, a difference of 7.1%.
Unemployment Among Ages 55 to 59 years Correlation Summary
| Measurement | Slavic | Immigrants from Honduras |
| Minimum | 1.4% | 1.3% |
| Maximum | 47.8% | 42.1% |
| Range | 46.4% | 40.8% |
| Mean | 11.5% | 6.6% |
| Median | 7.8% | 5.3% |
| Interquartile 25% (IQ1) | 5.2% | 4.5% |
| Interquartile 75% (IQ3) | 16.4% | 6.6% |
| Interquartile Range (IQR) | 11.2% | 2.1% |
| Standard Deviation (Sample) | 9.5% | 6.0% |
| Standard Deviation (Population) | 9.4% | 5.9% |
Similar Demographics by Unemployment Among Ages 55 to 59 years
Demographics Similar to Slavs by Unemployment Among Ages 55 to 59 years
In terms of unemployment among ages 55 to 59 years, the demographic groups most similar to Slavs are Colombian (4.7%, a difference of 0.010%), Delaware (4.7%, a difference of 0.010%), Panamanian (4.7%, a difference of 0.030%), Immigrants from Netherlands (4.7%, a difference of 0.060%), and Immigrants from Switzerland (4.7%, a difference of 0.060%).
| Demographics | Rating | Rank | Unemployment Among Ages 55 to 59 years |
| Pennsylvania Germans | 87.1 /100 | #128 | Excellent 4.7% |
| Immigrants | Sweden | 86.8 /100 | #129 | Excellent 4.7% |
| Greeks | 86.6 /100 | #130 | Excellent 4.7% |
| Immigrants | Thailand | 85.4 /100 | #131 | Excellent 4.7% |
| Immigrants | Romania | 85.3 /100 | #132 | Excellent 4.7% |
| Immigrants | Netherlands | 84.5 /100 | #133 | Excellent 4.7% |
| Panamanians | 84.1 /100 | #134 | Excellent 4.7% |
| Slavs | 83.7 /100 | #135 | Excellent 4.7% |
| Colombians | 83.6 /100 | #136 | Excellent 4.7% |
| Delaware | 83.6 /100 | #137 | Excellent 4.7% |
| Immigrants | Switzerland | 82.9 /100 | #138 | Excellent 4.7% |
| Romanians | 82.7 /100 | #139 | Excellent 4.7% |
| Immigrants | Indonesia | 80.2 /100 | #140 | Excellent 4.8% |
| French Canadians | 80.1 /100 | #141 | Excellent 4.8% |
| Immigrants | Norway | 79.8 /100 | #142 | Good 4.8% |
Demographics Similar to Immigrants from Honduras by Unemployment Among Ages 55 to 59 years
In terms of unemployment among ages 55 to 59 years, the demographic groups most similar to Immigrants from Honduras are Immigrants from Greece (5.1%, a difference of 0.010%), Soviet Union (5.1%, a difference of 0.030%), Native Hawaiian (5.1%, a difference of 0.17%), Comanche (5.1%, a difference of 0.20%), and Immigrants from Fiji (5.1%, a difference of 0.24%).
| Demographics | Rating | Rank | Unemployment Among Ages 55 to 59 years |
| Immigrants | Costa Rica | 1.1 /100 | #240 | Tragic 5.0% |
| Brazilians | 1.0 /100 | #241 | Tragic 5.0% |
| Liberians | 0.9 /100 | #242 | Tragic 5.1% |
| Hondurans | 0.7 /100 | #243 | Tragic 5.1% |
| Immigrants | Fiji | 0.7 /100 | #244 | Tragic 5.1% |
| Soviet Union | 0.6 /100 | #245 | Tragic 5.1% |
| Immigrants | Greece | 0.6 /100 | #246 | Tragic 5.1% |
| Immigrants | Honduras | 0.5 /100 | #247 | Tragic 5.1% |
| Native Hawaiians | 0.5 /100 | #248 | Tragic 5.1% |
| Comanche | 0.4 /100 | #249 | Tragic 5.1% |
| Cheyenne | 0.4 /100 | #250 | Tragic 5.1% |
| Portuguese | 0.3 /100 | #251 | Tragic 5.1% |
| U.S. Virgin Islanders | 0.3 /100 | #252 | Tragic 5.1% |
| Paraguayans | 0.3 /100 | #253 | Tragic 5.1% |
| Seminole | 0.3 /100 | #254 | Tragic 5.1% |