Seminole vs Immigrants from Liberia Unemployment Among Women with Children Under 6 years

COMPARE

Seminole
Race
Ancestry
AfghanAfricanAlaska NativeAlaskan AthabascanAlbanianAleutAlsatianAmericanApacheArabArapahoArgentineanArmenianAssyrian/Chaldean/SyriacAustralianAustrianBahamianBangladeshiBarbadianBasqueBelgianBelizeanBermudanBhutaneseBlackfeetBolivianBrazilianBritishBritish West IndianBulgarianBurmeseCajunCambodianCanadianCape VerdeanCarpatho RusynCelticCentral AmericanCentral American IndianCherokeeCheyenneChickasawChileanChineseChippewaChoctawColombianColvilleComancheCosta RicanCreeCreekCroatianCrowCubanCypriotCzechCzechoslovakianDanishDelawareDominicanDutchDutch West IndianEastern EuropeanEcuadorianEgyptianEnglishEstonianEthiopianEuropeanFijianFilipinoFinnishFrenchFrench American IndianFrench CanadianGermanGerman RussianGhanaianGreekGuamanian/ChamorroGuatemalanGuyaneseHaitianHmongHonduranHopiHoumaHungarianIcelanderIndian (Asian)IndonesianInupiatIranianIraqiIrishIroquoisIsraeliItalianJamaicanJapaneseJordanianKenyanKiowaKoreanLaotianLatvianLebaneseLiberianLithuanianLumbeeLuxembourgerMacedonianMalaysianMalteseMarshalleseMenomineeMexicanMexican American IndianMongolianMoroccanNative HawaiianNavajoNepaleseNew ZealanderNicaraguanNigerianNorthern EuropeanNorwegianOkinawanOsageOttawaPaiutePakistaniPalestinianPanamanianParaguayanPennsylvania GermanPeruvianPimaPolishPortuguesePotawatomiPuebloPuerto RicanPuget Sound SalishRomanianRussianSalvadoranSamoanScandinavianScotch-IrishScottishSeminoleSenegaleseSerbianShoshoneSierra LeoneanSiouxSlavicSlovakSloveneSomaliSouth AfricanSouth AmericanSouth American IndianSoviet UnionSpaniardSpanishSpanish AmericanSpanish American IndianSri LankanSubsaharan AfricanSudaneseSwedishSwissSyrianTaiwaneseThaiTlingit-HaidaTohono O'OdhamTonganTrinidadian and TobagonianTsimshianTurkishU.S. Virgin IslanderUgandanUkrainianUruguayanUteVenezuelanVietnameseWelshWest IndianYakamaYaquiYugoslavianYumanYup'ikZimbabwean
Immigration
NonimmigrantsImmigrantsAfghanistanAfricaAlbaniaArgentinaArmeniaAsiaAustraliaAustriaBahamasBangladeshBarbadosBelarusBelgiumBelizeBoliviaBosnia and HerzegovinaBrazilBulgariaBurma/MyanmarCabo VerdeCambodiaCameroonCanadaCaribbeanCentral AmericaChileChinaColombiaCongoCosta RicaCroatiaCubaCzechoslovakiaDenmarkDominicaDominican RepublicEastern AfricaEastern AsiaEastern EuropeEcuadorEgyptEl SalvadorEnglandEritreaEthiopiaEuropeFijiFranceGermanyGhanaGreeceGrenadaGuatemalaGuyanaHaitiHondurasHong KongHungaryIndiaIndonesiaIranIraqIrelandIsraelItalyJamaicaJapanJordanKazakhstanKenyaKoreaKuwaitLaosLatin AmericaLatviaLebanonLithuaniaMalaysiaMexicoMicronesiaMiddle AfricaMoldovaMoroccoNepalNetherlandsNicaraguaNigeriaNorth AmericaNorth MacedoniaNorthern AfricaNorthern EuropeNorwayOceaniaPakistanPanamaPeruPhilippinesPolandPortugalRomaniaRussiaSaudi ArabiaScotlandSenegalSerbiaSierra LeoneSingaporeSomaliaSouth AfricaSouth AmericaSouth Central AsiaSouth Eastern AsiaSouthern EuropeSpainSri LankaSt. Vincent and the GrenadinesSudanSwedenSwitzerlandSyriaTaiwanThailandTrinidad and TobagoTurkeyUgandaUkraineUruguayUzbekistanVenezuelaVietnamWest IndiesWestern AfricaWestern AsiaWestern EuropeYemenZaireZimbabweAzores
Immigrants from Liberia
Race
Ancestry
AfghanAfricanAlaska NativeAlaskan AthabascanAlbanianAleutAlsatianAmericanApacheArabArapahoArgentineanArmenianAssyrian/Chaldean/SyriacAustralianAustrianBahamianBangladeshiBarbadianBasqueBelgianBelizeanBermudanBhutaneseBlackfeetBolivianBrazilianBritishBritish West IndianBulgarianBurmeseCajunCambodianCanadianCape VerdeanCarpatho RusynCelticCentral AmericanCentral American IndianCherokeeCheyenneChickasawChileanChineseChippewaChoctawColombianColvilleComancheCosta RicanCreeCreekCroatianCrowCubanCypriotCzechCzechoslovakianDanishDelawareDominicanDutchDutch West IndianEastern EuropeanEcuadorianEgyptianEnglishEstonianEthiopianEuropeanFijianFilipinoFinnishFrenchFrench American IndianFrench CanadianGermanGerman RussianGhanaianGreekGuamanian/ChamorroGuatemalanGuyaneseHaitianHmongHonduranHopiHoumaHungarianIcelanderIndian (Asian)IndonesianInupiatIranianIraqiIrishIroquoisIsraeliItalianJamaicanJapaneseJordanianKenyanKiowaKoreanLaotianLatvianLebaneseLiberianLithuanianLumbeeLuxembourgerMacedonianMalaysianMalteseMarshalleseMenomineeMexicanMexican American IndianMongolianMoroccanNative HawaiianNavajoNepaleseNew ZealanderNicaraguanNigerianNorthern EuropeanNorwegianOkinawanOsageOttawaPaiutePakistaniPalestinianPanamanianParaguayanPennsylvania GermanPeruvianPimaPolishPortuguesePotawatomiPuebloPuerto RicanPuget Sound SalishRomanianRussianSalvadoranSamoanScandinavianScotch-IrishScottishSenegaleseSerbianShoshoneSierra LeoneanSiouxSlavicSlovakSloveneSomaliSouth AfricanSouth AmericanSouth American IndianSoviet UnionSpaniardSpanishSpanish AmericanSpanish American IndianSri LankanSubsaharan AfricanSudaneseSwedishSwissSyrianTaiwaneseThaiTlingit-HaidaTohono O'OdhamTonganTrinidadian and TobagonianTsimshianTurkishU.S. Virgin IslanderUgandanUkrainianUruguayanUteVenezuelanVietnameseWelshWest IndianYakamaYaquiYugoslavianYumanYup'ikZimbabwean
Immigration
NonimmigrantsImmigrantsAfghanistanAfricaAlbaniaArgentinaArmeniaAsiaAustraliaAustriaBahamasBangladeshBarbadosBelarusBelgiumBelizeBoliviaBosnia and HerzegovinaBrazilBulgariaBurma/MyanmarCabo VerdeCambodiaCameroonCanadaCaribbeanCentral AmericaChileChinaColombiaCongoCosta RicaCroatiaCubaCzechoslovakiaDenmarkDominicaDominican RepublicEastern AfricaEastern AsiaEastern EuropeEcuadorEgyptEl SalvadorEnglandEritreaEthiopiaEuropeFijiFranceGermanyGhanaGreeceGrenadaGuatemalaGuyanaHaitiHondurasHong KongHungaryIndiaIndonesiaIranIraqIrelandIsraelItalyJamaicaJapanJordanKazakhstanKenyaKoreaKuwaitLaosLatin AmericaLatviaLebanonLiberiaLithuaniaMalaysiaMexicoMicronesiaMiddle AfricaMoldovaMoroccoNepalNetherlandsNicaraguaNigeriaNorth AmericaNorth MacedoniaNorthern AfricaNorthern EuropeNorwayOceaniaPakistanPanamaPeruPhilippinesPolandPortugalRomaniaRussiaSaudi ArabiaScotlandSenegalSerbiaSierra LeoneSingaporeSomaliaSouth AfricaSouth AmericaSouth Central AsiaSouth Eastern AsiaSouthern EuropeSpainSri LankaSt. Vincent and the GrenadinesSudanSwedenSwitzerlandSyriaTaiwanThailandTrinidad and TobagoTurkeyUgandaUkraineUruguayUzbekistanVenezuelaVietnamWest IndiesWestern AfricaWestern AsiaWestern EuropeYemenZaireZimbabweAzores
Unemployment Among Women with Children Under 6 years
Income
Poverty
Unemployment
Labor Participation
Family Structure
Vehicle Availability
Education Level
Disability

Unemployment Among Women with Children Under 6 years Comparison

Seminole

Immigrants from Liberia

Tragic
Tragic
8.7%
UNEMPLOYMENT AMONG WOMEN WITH CHILDREN UNDER 6 YEARS
0.0/ 100
METRIC RATING
286th/ 347
METRIC RANK
8.4%
UNEMPLOYMENT AMONG WOMEN WITH CHILDREN UNDER 6 YEARS
0.3/ 100
METRIC RATING
261st/ 347
METRIC RANK

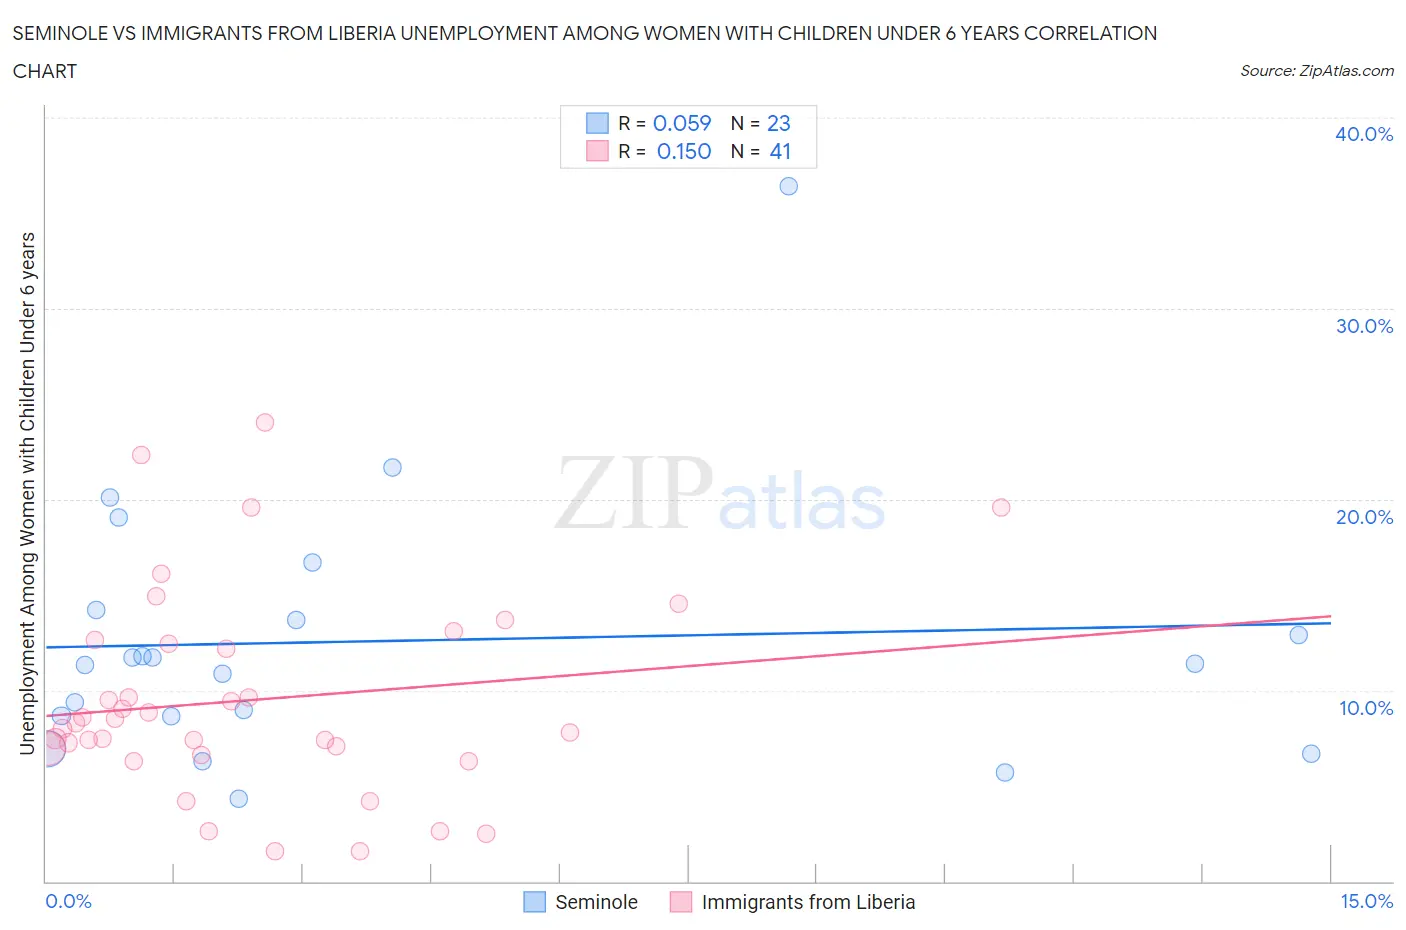
Seminole vs Immigrants from Liberia Unemployment Among Women with Children Under 6 years Correlation Chart

The statistical analysis conducted on geographies consisting of 105,546,612 people shows a slight positive correlation between the proportion of Seminole and unemployment rate among women with children under the age of 6 in the United States with a correlation coefficient (R) of 0.059 and weighted average of 8.7%. Similarly, the statistical analysis conducted on geographies consisting of 122,027,858 people shows a poor positive correlation between the proportion of Immigrants from Liberia and unemployment rate among women with children under the age of 6 in the United States with a correlation coefficient (R) of 0.150 and weighted average of 8.4%, a difference of 3.7%.
Seminole vs Immigrants from Liberia Unemployment Among Women with Children Under 6 years

Unemployment Among Women with Children Under 6 years Correlation Summary

MeasurementSeminoleImmigrants from Liberia
Minimum4.3%1.6%
Maximum36.4%24.0%
Range32.1%22.4%
Mean12.6%9.5%
Median11.4%8.3%
Interquartile 25% (IQ1)8.6%6.8%
Interquartile 75% (IQ3)14.2%12.5%
Interquartile Range (IQR)5.6%5.7%
Standard Deviation (Sample)6.9%5.3%
Standard Deviation (Population)6.8%5.3%

Similar Demographics by Unemployment Among Women with Children Under 6 years

Demographics Similar to Seminole by Unemployment Among Women with Children Under 6 years

In terms of unemployment among women with children under 6 years, the demographic groups most similar to Seminole are U.S. Virgin Islander (8.7%, a difference of 0.0%), Menominee (8.7%, a difference of 0.15%), Blackfeet (8.7%, a difference of 0.20%), Bahamian (8.7%, a difference of 0.35%), and Spanish American Indian (8.7%, a difference of 0.36%).
DemographicsRating | RankUnemployment Among Women with Children Under 6 years
Immigrants | Guatemala
0.0
/100
|
#279
Tragic
8.6%
Immigrants | Belize
0.0
/100
|
#280
Tragic
8.6%
Guatemalans
0.0
/100
|
#281
Tragic
8.7%
Bermudans
0.0
/100
|
#282
Tragic
8.7%
Spanish American Indians
0.0
/100
|
#283
Tragic
8.7%
Blackfeet
0.0
/100
|
#284
Tragic
8.7%
U.S. Virgin Islanders
0.0
/100
|
#285
Tragic
8.7%
Seminole
0.0
/100
|
#286
Tragic
8.7%
Menominee
0.0
/100
|
#287
Tragic
8.7%
Bahamians
0.0
/100
|
#288
Tragic
8.7%
Iroquois
0.0
/100
|
#289
Tragic
8.7%
Vietnamese
0.0
/100
|
#290
Tragic
8.8%
Jamaicans
0.0
/100
|
#291
Tragic
8.8%
Cheyenne
0.0
/100
|
#292
Tragic
8.8%
Immigrants | Bangladesh
0.0
/100
|
#293
Tragic
8.8%

Demographics Similar to Immigrants from Liberia by Unemployment Among Women with Children Under 6 years

In terms of unemployment among women with children under 6 years, the demographic groups most similar to Immigrants from Liberia are West Indian (8.4%, a difference of 0.010%), Scotch-Irish (8.4%, a difference of 0.040%), Honduran (8.4%, a difference of 0.060%), French Canadian (8.4%, a difference of 0.11%), and Immigrants from Honduras (8.4%, a difference of 0.12%).
DemographicsRating | RankUnemployment Among Women with Children Under 6 years
Immigrants | Caribbean
0.7
/100
|
#254
Tragic
8.3%
Immigrants | Portugal
0.6
/100
|
#255
Tragic
8.3%
Celtics
0.6
/100
|
#256
Tragic
8.3%
British West Indians
0.5
/100
|
#257
Tragic
8.3%
Immigrants | Ghana
0.5
/100
|
#258
Tragic
8.3%
Barbadians
0.4
/100
|
#259
Tragic
8.3%
Whites/Caucasians
0.3
/100
|
#260
Tragic
8.4%
Immigrants | Liberia
0.3
/100
|
#261
Tragic
8.4%
West Indians
0.3
/100
|
#262
Tragic
8.4%
Scotch-Irish
0.3
/100
|
#263
Tragic
8.4%
Hondurans
0.3
/100
|
#264
Tragic
8.4%
French Canadians
0.3
/100
|
#265
Tragic
8.4%
Immigrants | Honduras
0.3
/100
|
#266
Tragic
8.4%
Belizeans
0.2
/100
|
#267
Tragic
8.4%
Sub-Saharan Africans
0.2
/100
|
#268
Tragic
8.4%