Immigrants from Venezuela vs Immigrants from Liberia Unemployment Among Women with Children Under 6 years
COMPARE
Immigrants from Venezuela
Immigrants from Liberia
Unemployment Among Women with Children Under 6 years
Unemployment Among Women with Children Under 6 years Comparison
Immigrants from Venezuela
Immigrants from Liberia
7.1%
UNEMPLOYMENT AMONG WOMEN WITH CHILDREN UNDER 6 YEARS
98.8/ 100
METRIC RATING
81st/ 347
METRIC RANK
8.4%
UNEMPLOYMENT AMONG WOMEN WITH CHILDREN UNDER 6 YEARS
0.3/ 100
METRIC RATING
261st/ 347
METRIC RANK
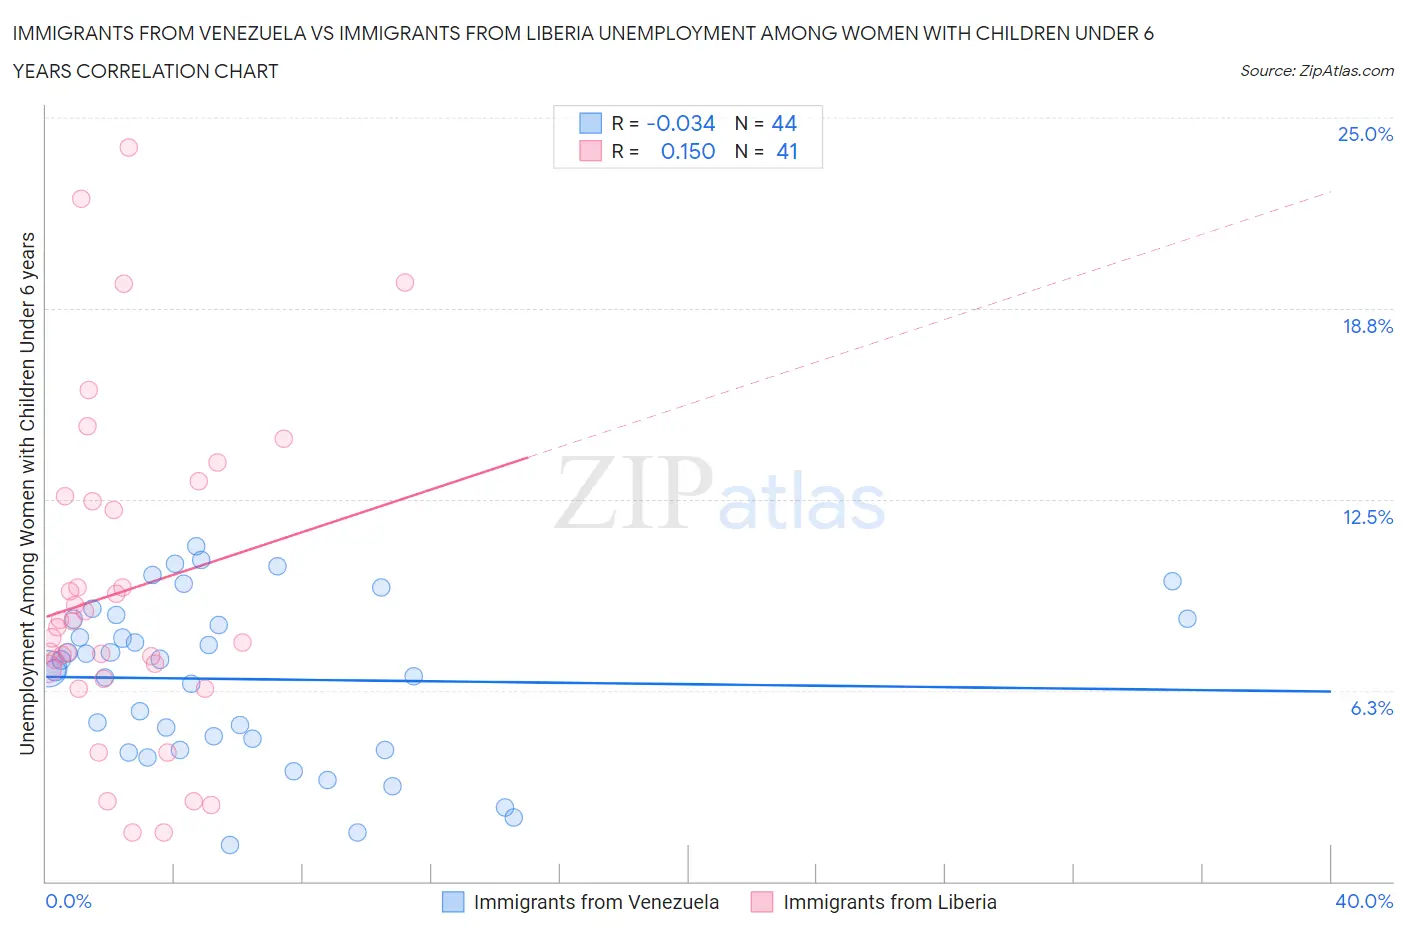
Immigrants from Venezuela vs Immigrants from Liberia Unemployment Among Women with Children Under 6 years Correlation Chart
The statistical analysis conducted on geographies consisting of 233,969,116 people shows no correlation between the proportion of Immigrants from Venezuela and unemployment rate among women with children under the age of 6 in the United States with a correlation coefficient (R) of -0.034 and weighted average of 7.1%. Similarly, the statistical analysis conducted on geographies consisting of 122,027,858 people shows a poor positive correlation between the proportion of Immigrants from Liberia and unemployment rate among women with children under the age of 6 in the United States with a correlation coefficient (R) of 0.150 and weighted average of 8.4%, a difference of 18.4%.
Unemployment Among Women with Children Under 6 years Correlation Summary
| Measurement | Immigrants from Venezuela | Immigrants from Liberia |
| Minimum | 1.2% | 1.6% |
| Maximum | 11.0% | 24.0% |
| Range | 9.8% | 22.4% |
| Mean | 6.6% | 9.5% |
| Median | 7.1% | 8.3% |
| Interquartile 25% (IQ1) | 4.5% | 6.8% |
| Interquartile 75% (IQ3) | 8.6% | 12.5% |
| Interquartile Range (IQR) | 4.1% | 5.7% |
| Standard Deviation (Sample) | 2.6% | 5.3% |
| Standard Deviation (Population) | 2.6% | 5.3% |
Similar Demographics by Unemployment Among Women with Children Under 6 years
Demographics Similar to Immigrants from Venezuela by Unemployment Among Women with Children Under 6 years
In terms of unemployment among women with children under 6 years, the demographic groups most similar to Immigrants from Venezuela are Immigrants from Greece (7.1%, a difference of 0.040%), Immigrants from Fiji (7.1%, a difference of 0.060%), Immigrants from Somalia (7.1%, a difference of 0.11%), Immigrants from Croatia (7.1%, a difference of 0.15%), and Immigrants from Afghanistan (7.1%, a difference of 0.15%).
| Demographics | Rating | Rank | Unemployment Among Women with Children Under 6 years |
| Turks | 99.2 /100 | #74 | Exceptional 7.0% |
| Immigrants | Eastern Europe | 99.0 /100 | #75 | Exceptional 7.1% |
| Estonians | 99.0 /100 | #76 | Exceptional 7.1% |
| Immigrants | Croatia | 98.9 /100 | #77 | Exceptional 7.1% |
| Immigrants | Somalia | 98.9 /100 | #78 | Exceptional 7.1% |
| Immigrants | Fiji | 98.9 /100 | #79 | Exceptional 7.1% |
| Immigrants | Greece | 98.9 /100 | #80 | Exceptional 7.1% |
| Immigrants | Venezuela | 98.8 /100 | #81 | Exceptional 7.1% |
| Immigrants | Afghanistan | 98.7 /100 | #82 | Exceptional 7.1% |
| Egyptians | 98.7 /100 | #83 | Exceptional 7.1% |
| Immigrants | Albania | 98.7 /100 | #84 | Exceptional 7.1% |
| Immigrants | Romania | 98.7 /100 | #85 | Exceptional 7.1% |
| Immigrants | Zimbabwe | 98.6 /100 | #86 | Exceptional 7.1% |
| Alsatians | 98.4 /100 | #87 | Exceptional 7.1% |
| Immigrants | Hungary | 98.3 /100 | #88 | Exceptional 7.1% |
Demographics Similar to Immigrants from Liberia by Unemployment Among Women with Children Under 6 years
In terms of unemployment among women with children under 6 years, the demographic groups most similar to Immigrants from Liberia are West Indian (8.4%, a difference of 0.010%), Scotch-Irish (8.4%, a difference of 0.040%), Honduran (8.4%, a difference of 0.060%), French Canadian (8.4%, a difference of 0.11%), and Immigrants from Honduras (8.4%, a difference of 0.12%).
| Demographics | Rating | Rank | Unemployment Among Women with Children Under 6 years |
| Immigrants | Caribbean | 0.7 /100 | #254 | Tragic 8.3% |
| Immigrants | Portugal | 0.6 /100 | #255 | Tragic 8.3% |
| Celtics | 0.6 /100 | #256 | Tragic 8.3% |
| British West Indians | 0.5 /100 | #257 | Tragic 8.3% |
| Immigrants | Ghana | 0.5 /100 | #258 | Tragic 8.3% |
| Barbadians | 0.4 /100 | #259 | Tragic 8.3% |
| Whites/Caucasians | 0.3 /100 | #260 | Tragic 8.4% |
| Immigrants | Liberia | 0.3 /100 | #261 | Tragic 8.4% |
| West Indians | 0.3 /100 | #262 | Tragic 8.4% |
| Scotch-Irish | 0.3 /100 | #263 | Tragic 8.4% |
| Hondurans | 0.3 /100 | #264 | Tragic 8.4% |
| French Canadians | 0.3 /100 | #265 | Tragic 8.4% |
| Immigrants | Honduras | 0.3 /100 | #266 | Tragic 8.4% |
| Belizeans | 0.2 /100 | #267 | Tragic 8.4% |
| Sub-Saharan Africans | 0.2 /100 | #268 | Tragic 8.4% |