Slavic vs Immigrants from Afghanistan Unemployment Among Ages 45 to 54 years
COMPARE
Slavic
Immigrants from Afghanistan
Unemployment Among Ages 45 to 54 years
Unemployment Among Ages 45 to 54 years Comparison
Slavs
Immigrants from Afghanistan
4.3%
UNEMPLOYMENT AMONG AGES 45 TO 54 YEARS
98.1/ 100
METRIC RATING
76th/ 347
METRIC RANK
4.4%
UNEMPLOYMENT AMONG AGES 45 TO 54 YEARS
79.6/ 100
METRIC RATING
141st/ 347
METRIC RANK
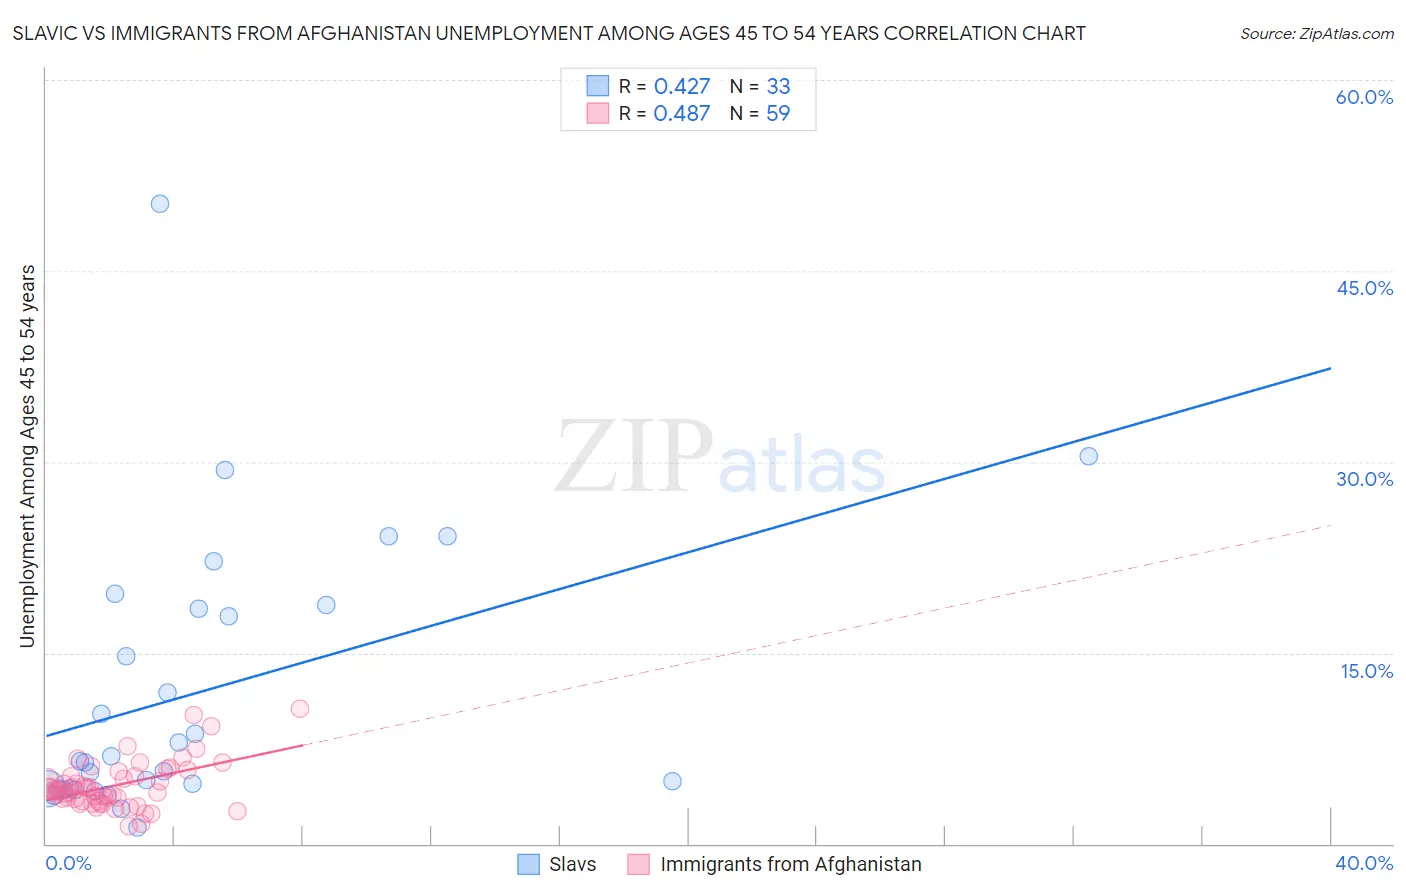
Slavic vs Immigrants from Afghanistan Unemployment Among Ages 45 to 54 years Correlation Chart
The statistical analysis conducted on geographies consisting of 265,342,619 people shows a moderate positive correlation between the proportion of Slavs and unemployment rate among population between the ages 45 and 54 in the United States with a correlation coefficient (R) of 0.427 and weighted average of 4.3%. Similarly, the statistical analysis conducted on geographies consisting of 146,637,469 people shows a moderate positive correlation between the proportion of Immigrants from Afghanistan and unemployment rate among population between the ages 45 and 54 in the United States with a correlation coefficient (R) of 0.487 and weighted average of 4.4%, a difference of 3.2%.
Unemployment Among Ages 45 to 54 years Correlation Summary
| Measurement | Slavic | Immigrants from Afghanistan |
| Minimum | 1.3% | 1.4% |
| Maximum | 50.3% | 10.6% |
| Range | 49.1% | 9.2% |
| Mean | 11.9% | 4.6% |
| Median | 6.5% | 4.2% |
| Interquartile 25% (IQ1) | 4.3% | 3.3% |
| Interquartile 75% (IQ3) | 18.6% | 5.3% |
| Interquartile Range (IQR) | 14.3% | 2.0% |
| Standard Deviation (Sample) | 10.8% | 1.8% |
| Standard Deviation (Population) | 10.7% | 1.8% |
Similar Demographics by Unemployment Among Ages 45 to 54 years
Demographics Similar to Slavs by Unemployment Among Ages 45 to 54 years
In terms of unemployment among ages 45 to 54 years, the demographic groups most similar to Slavs are Kenyan (4.3%, a difference of 0.010%), Immigrants from Belgium (4.3%, a difference of 0.030%), Canadian (4.3%, a difference of 0.040%), Chilean (4.3%, a difference of 0.050%), and German Russian (4.3%, a difference of 0.14%).
| Demographics | Rating | Rank | Unemployment Among Ages 45 to 54 years |
| Immigrants | Japan | 98.7 /100 | #69 | Exceptional 4.3% |
| Paraguayans | 98.6 /100 | #70 | Exceptional 4.3% |
| Palestinians | 98.5 /100 | #71 | Exceptional 4.3% |
| Whites/Caucasians | 98.4 /100 | #72 | Exceptional 4.3% |
| Canadians | 98.2 /100 | #73 | Exceptional 4.3% |
| Immigrants | Belgium | 98.2 /100 | #74 | Exceptional 4.3% |
| Kenyans | 98.1 /100 | #75 | Exceptional 4.3% |
| Slavs | 98.1 /100 | #76 | Exceptional 4.3% |
| Chileans | 98.1 /100 | #77 | Exceptional 4.3% |
| German Russians | 97.9 /100 | #78 | Exceptional 4.3% |
| Serbians | 97.9 /100 | #79 | Exceptional 4.3% |
| Cambodians | 97.8 /100 | #80 | Exceptional 4.3% |
| Immigrants | Micronesia | 97.6 /100 | #81 | Exceptional 4.3% |
| Eastern Europeans | 97.6 /100 | #82 | Exceptional 4.3% |
| Australians | 97.4 /100 | #83 | Exceptional 4.3% |
Demographics Similar to Immigrants from Afghanistan by Unemployment Among Ages 45 to 54 years
In terms of unemployment among ages 45 to 54 years, the demographic groups most similar to Immigrants from Afghanistan are Immigrants from Netherlands (4.4%, a difference of 0.020%), Macedonian (4.5%, a difference of 0.040%), Immigrants from Zaire (4.4%, a difference of 0.080%), Taiwanese (4.5%, a difference of 0.12%), and Immigrants from Latvia (4.5%, a difference of 0.15%).
| Demographics | Rating | Rank | Unemployment Among Ages 45 to 54 years |
| Afghans | 84.6 /100 | #134 | Excellent 4.4% |
| Immigrants | Eastern Asia | 84.0 /100 | #135 | Excellent 4.4% |
| Immigrants | Middle Africa | 83.3 /100 | #136 | Excellent 4.4% |
| Lebanese | 81.9 /100 | #137 | Excellent 4.4% |
| Immigrants | Congo | 81.8 /100 | #138 | Excellent 4.4% |
| Immigrants | Kuwait | 81.7 /100 | #139 | Excellent 4.4% |
| Immigrants | Zaire | 80.7 /100 | #140 | Excellent 4.4% |
| Immigrants | Afghanistan | 79.6 /100 | #141 | Good 4.4% |
| Immigrants | Netherlands | 79.4 /100 | #142 | Good 4.4% |
| Macedonians | 79.0 /100 | #143 | Good 4.5% |
| Taiwanese | 77.9 /100 | #144 | Good 4.5% |
| Immigrants | Latvia | 77.5 /100 | #145 | Good 4.5% |
| Syrians | 77.3 /100 | #146 | Good 4.5% |
| Uruguayans | 76.9 /100 | #147 | Good 4.5% |
| Immigrants | Austria | 75.3 /100 | #148 | Good 4.5% |