Venezuelan vs Immigrants from Jordan Unemployment
COMPARE
Venezuelan
Immigrants from Jordan
Unemployment
Unemployment Comparison
Venezuelans
Immigrants from Jordan
4.7%
UNEMPLOYMENT
99.9/ 100
METRIC RATING
24th/ 347
METRIC RANK
5.1%
UNEMPLOYMENT
86.6/ 100
METRIC RATING
133rd/ 347
METRIC RANK
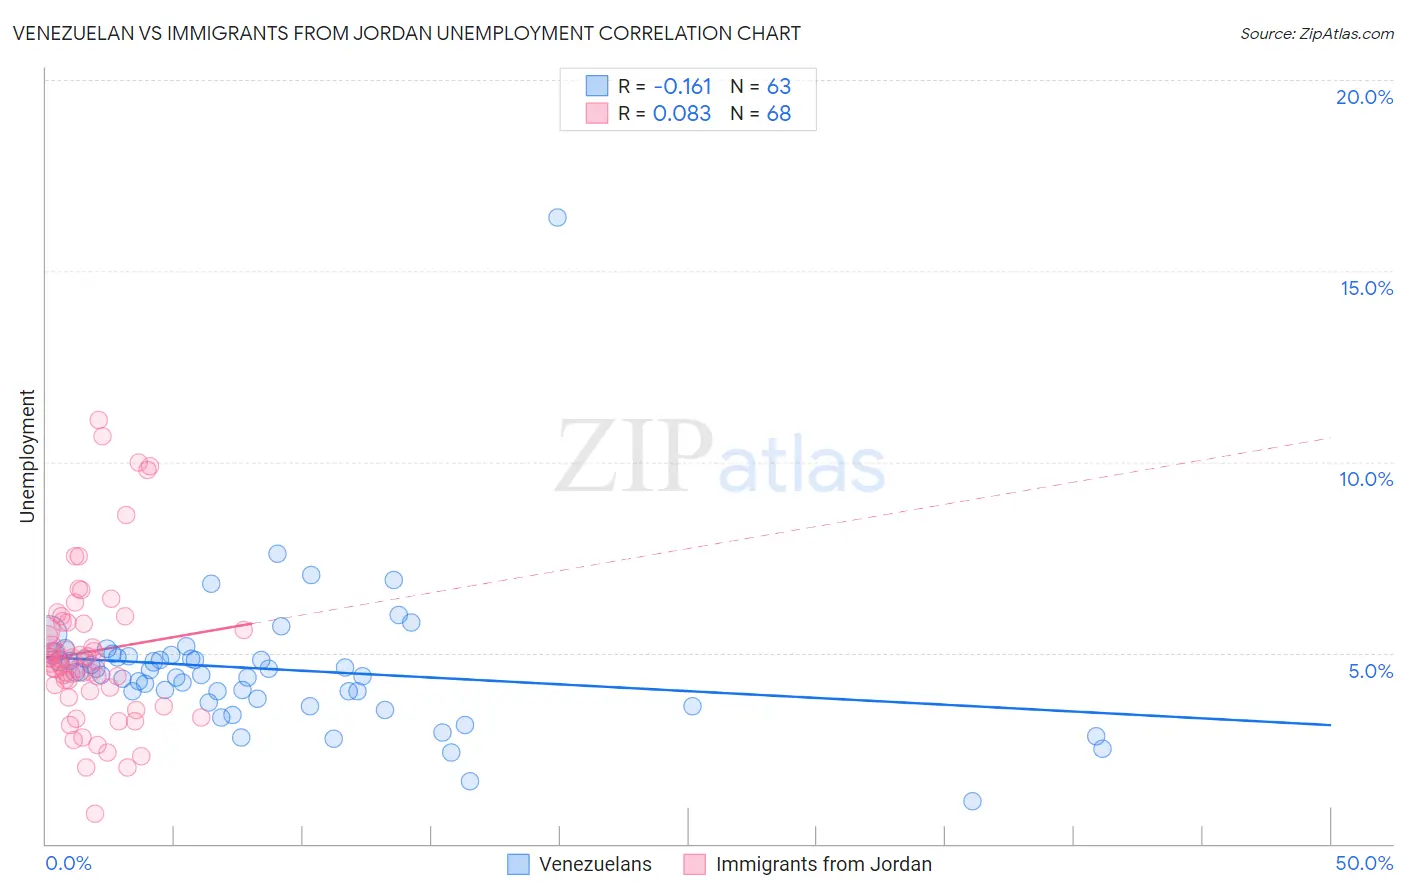
Venezuelan vs Immigrants from Jordan Unemployment Correlation Chart
The statistical analysis conducted on geographies consisting of 306,194,859 people shows a poor negative correlation between the proportion of Venezuelans and unemployment in the United States with a correlation coefficient (R) of -0.161 and weighted average of 4.7%. Similarly, the statistical analysis conducted on geographies consisting of 181,256,690 people shows a slight positive correlation between the proportion of Immigrants from Jordan and unemployment in the United States with a correlation coefficient (R) of 0.083 and weighted average of 5.1%, a difference of 8.5%.
Unemployment Correlation Summary
| Measurement | Venezuelan | Immigrants from Jordan |
| Minimum | 1.1% | 0.80% |
| Maximum | 16.4% | 11.1% |
| Range | 15.3% | 10.3% |
| Mean | 4.6% | 5.0% |
| Median | 4.5% | 4.7% |
| Interquartile 25% (IQ1) | 3.8% | 4.1% |
| Interquartile 75% (IQ3) | 4.9% | 5.8% |
| Interquartile Range (IQR) | 1.1% | 1.7% |
| Standard Deviation (Sample) | 1.9% | 2.0% |
| Standard Deviation (Population) | 1.9% | 2.0% |
Similar Demographics by Unemployment
Demographics Similar to Venezuelans by Unemployment
In terms of unemployment, the demographic groups most similar to Venezuelans are Latvian (4.7%, a difference of 0.070%), British (4.7%, a difference of 0.080%), Bulgarian (4.7%, a difference of 0.11%), Finnish (4.7%, a difference of 0.32%), and Welsh (4.7%, a difference of 0.38%).
| Demographics | Rating | Rank | Unemployment |
| Slovenes | 99.9 /100 | #17 | Exceptional 4.7% |
| Immigrants | Venezuela | 99.9 /100 | #18 | Exceptional 4.7% |
| Scottish | 99.9 /100 | #19 | Exceptional 4.7% |
| Carpatho Rusyns | 99.9 /100 | #20 | Exceptional 4.7% |
| Welsh | 99.9 /100 | #21 | Exceptional 4.7% |
| Thais | 99.9 /100 | #22 | Exceptional 4.7% |
| British | 99.9 /100 | #23 | Exceptional 4.7% |
| Venezuelans | 99.9 /100 | #24 | Exceptional 4.7% |
| Latvians | 99.9 /100 | #25 | Exceptional 4.7% |
| Bulgarians | 99.9 /100 | #26 | Exceptional 4.7% |
| Finns | 99.9 /100 | #27 | Exceptional 4.7% |
| Cubans | 99.8 /100 | #28 | Exceptional 4.7% |
| Poles | 99.8 /100 | #29 | Exceptional 4.7% |
| Irish | 99.8 /100 | #30 | Exceptional 4.8% |
| Croatians | 99.8 /100 | #31 | Exceptional 4.8% |
Demographics Similar to Immigrants from Jordan by Unemployment
In terms of unemployment, the demographic groups most similar to Immigrants from Jordan are Immigrants from Ethiopia (5.1%, a difference of 0.010%), Immigrants from Croatia (5.1%, a difference of 0.020%), Iranian (5.1%, a difference of 0.040%), Immigrants from Europe (5.1%, a difference of 0.040%), and Immigrants from Burma/Myanmar (5.1%, a difference of 0.050%).
| Demographics | Rating | Rank | Unemployment |
| Kenyans | 88.2 /100 | #126 | Excellent 5.1% |
| Immigrants | Kenya | 88.2 /100 | #127 | Excellent 5.1% |
| Immigrants | Eastern Africa | 88.1 /100 | #128 | Excellent 5.1% |
| Immigrants | Latvia | 88.0 /100 | #129 | Excellent 5.1% |
| Iranians | 86.9 /100 | #130 | Excellent 5.1% |
| Immigrants | Croatia | 86.8 /100 | #131 | Excellent 5.1% |
| Immigrants | Ethiopia | 86.7 /100 | #132 | Excellent 5.1% |
| Immigrants | Jordan | 86.6 /100 | #133 | Excellent 5.1% |
| Immigrants | Europe | 86.3 /100 | #134 | Excellent 5.1% |
| Immigrants | Burma/Myanmar | 86.2 /100 | #135 | Excellent 5.1% |
| Immigrants | Spain | 86.2 /100 | #136 | Excellent 5.1% |
| Immigrants | Saudi Arabia | 85.6 /100 | #137 | Excellent 5.1% |
| Immigrants | Hungary | 85.6 /100 | #138 | Excellent 5.1% |
| Pakistanis | 85.3 /100 | #139 | Excellent 5.1% |
| Immigrants | Denmark | 84.3 /100 | #140 | Excellent 5.1% |