Sioux vs Immigrants from Bulgaria Unemployment Among Women with Children Ages 6 to 17 years
COMPARE
Sioux
Immigrants from Bulgaria
Unemployment Among Women with Children Ages 6 to 17 years
Unemployment Among Women with Children Ages 6 to 17 years Comparison
Sioux
Immigrants from Bulgaria
13.2%
UNEMPLOYMENT AMONG WOMEN WITH CHILDREN AGES 6 TO 17 YEARS
0.0/ 100
METRIC RATING
339th/ 347
METRIC RANK
8.1%
UNEMPLOYMENT AMONG WOMEN WITH CHILDREN AGES 6 TO 17 YEARS
100.0/ 100
METRIC RATING
45th/ 347
METRIC RANK
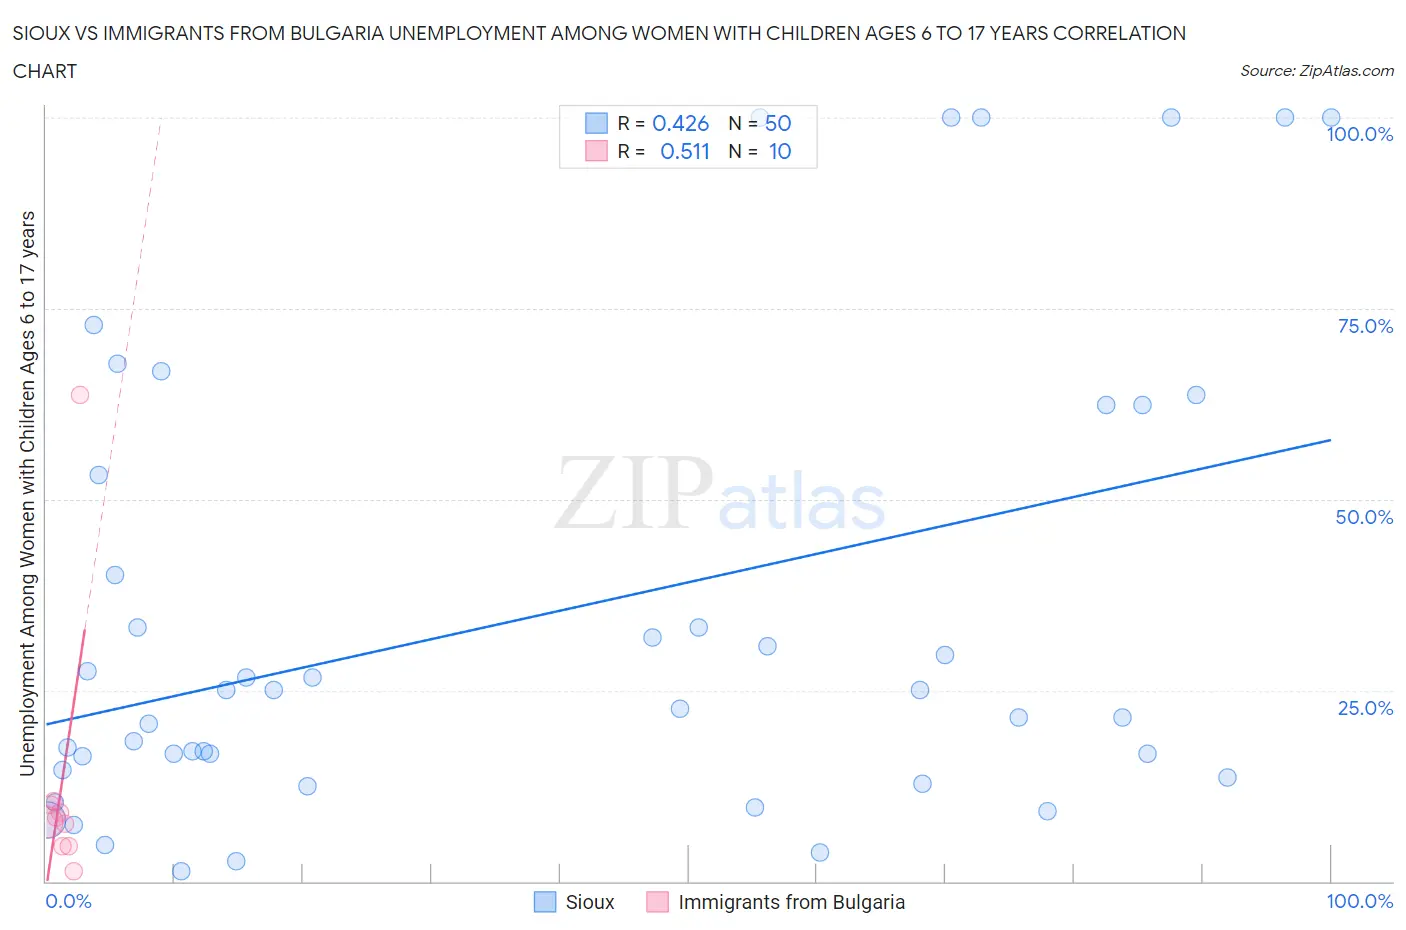
Sioux vs Immigrants from Bulgaria Unemployment Among Women with Children Ages 6 to 17 years Correlation Chart
The statistical analysis conducted on geographies consisting of 181,726,267 people shows a moderate positive correlation between the proportion of Sioux and unemployment rate among women with children between the ages 6 and 17 in the United States with a correlation coefficient (R) of 0.426 and weighted average of 13.2%. Similarly, the statistical analysis conducted on geographies consisting of 140,311,007 people shows a substantial positive correlation between the proportion of Immigrants from Bulgaria and unemployment rate among women with children between the ages 6 and 17 in the United States with a correlation coefficient (R) of 0.511 and weighted average of 8.1%, a difference of 64.1%.
Unemployment Among Women with Children Ages 6 to 17 years Correlation Summary
| Measurement | Sioux | Immigrants from Bulgaria |
| Minimum | 1.3% | 1.3% |
| Maximum | 100.0% | 63.6% |
| Range | 98.7% | 62.3% |
| Mean | 34.7% | 12.7% |
| Median | 23.8% | 8.0% |
| Interquartile 25% (IQ1) | 14.6% | 4.6% |
| Interquartile 75% (IQ3) | 53.2% | 10.0% |
| Interquartile Range (IQR) | 38.6% | 5.4% |
| Standard Deviation (Sample) | 30.2% | 18.1% |
| Standard Deviation (Population) | 29.9% | 17.2% |
Similar Demographics by Unemployment Among Women with Children Ages 6 to 17 years
Demographics Similar to Sioux by Unemployment Among Women with Children Ages 6 to 17 years
In terms of unemployment among women with children ages 6 to 17 years, the demographic groups most similar to Sioux are Hopi (12.9%, a difference of 2.7%), Immigrants from Yemen (12.7%, a difference of 4.2%), Puerto Rican (13.9%, a difference of 4.8%), Houma (12.5%, a difference of 6.2%), and Navajo (14.2%, a difference of 6.9%).
| Demographics | Rating | Rank | Unemployment Among Women with Children Ages 6 to 17 years |
| Tsimshian | 0.0 /100 | #332 | Tragic 11.4% |
| Natives/Alaskans | 0.0 /100 | #333 | Tragic 11.5% |
| Ugandans | 0.0 /100 | #334 | Tragic 12.0% |
| Colville | 0.0 /100 | #335 | Tragic 12.3% |
| Houma | 0.0 /100 | #336 | Tragic 12.5% |
| Immigrants | Yemen | 0.0 /100 | #337 | Tragic 12.7% |
| Hopi | 0.0 /100 | #338 | Tragic 12.9% |
| Sioux | 0.0 /100 | #339 | Tragic 13.2% |
| Puerto Ricans | 0.0 /100 | #340 | Tragic 13.9% |
| Navajo | 0.0 /100 | #341 | Tragic 14.2% |
| Yuman | 0.0 /100 | #342 | Tragic 14.8% |
| Inupiat | 0.0 /100 | #343 | Tragic 14.9% |
| Cheyenne | 0.0 /100 | #344 | Tragic 16.4% |
| Arapaho | 0.0 /100 | #345 | Tragic 16.8% |
| Yup'ik | 0.0 /100 | #346 | Tragic 18.6% |
Demographics Similar to Immigrants from Bulgaria by Unemployment Among Women with Children Ages 6 to 17 years
In terms of unemployment among women with children ages 6 to 17 years, the demographic groups most similar to Immigrants from Bulgaria are Icelander (8.1%, a difference of 0.020%), Immigrants from Sweden (8.1%, a difference of 0.050%), Immigrants from Switzerland (8.1%, a difference of 0.060%), Bhutanese (8.1%, a difference of 0.080%), and Immigrants from Asia (8.1%, a difference of 0.18%).
| Demographics | Rating | Rank | Unemployment Among Women with Children Ages 6 to 17 years |
| Alsatians | 100.0 /100 | #38 | Exceptional 8.0% |
| Somalis | 100.0 /100 | #39 | Exceptional 8.0% |
| Immigrants | Zimbabwe | 100.0 /100 | #40 | Exceptional 8.0% |
| Iranians | 100.0 /100 | #41 | Exceptional 8.0% |
| Immigrants | Somalia | 100.0 /100 | #42 | Exceptional 8.0% |
| Bhutanese | 100.0 /100 | #43 | Exceptional 8.1% |
| Immigrants | Sweden | 100.0 /100 | #44 | Exceptional 8.1% |
| Immigrants | Bulgaria | 100.0 /100 | #45 | Exceptional 8.1% |
| Icelanders | 100.0 /100 | #46 | Exceptional 8.1% |
| Immigrants | Switzerland | 100.0 /100 | #47 | Exceptional 8.1% |
| Immigrants | Asia | 100.0 /100 | #48 | Exceptional 8.1% |
| Immigrants | Oceania | 100.0 /100 | #49 | Exceptional 8.1% |
| Hawaiians | 100.0 /100 | #50 | Exceptional 8.1% |
| Immigrants | Sudan | 100.0 /100 | #51 | Exceptional 8.1% |
| Immigrants | Iraq | 100.0 /100 | #52 | Exceptional 8.1% |