Immigrants from Romania vs Immigrants from Bulgaria Unemployment Among Women with Children Ages 6 to 17 years
COMPARE
Immigrants from Romania
Immigrants from Bulgaria
Unemployment Among Women with Children Ages 6 to 17 years
Unemployment Among Women with Children Ages 6 to 17 years Comparison
Immigrants from Romania
Immigrants from Bulgaria
8.6%
UNEMPLOYMENT AMONG WOMEN WITH CHILDREN AGES 6 TO 17 YEARS
97.5/ 100
METRIC RATING
109th/ 347
METRIC RANK
8.1%
UNEMPLOYMENT AMONG WOMEN WITH CHILDREN AGES 6 TO 17 YEARS
100.0/ 100
METRIC RATING
45th/ 347
METRIC RANK
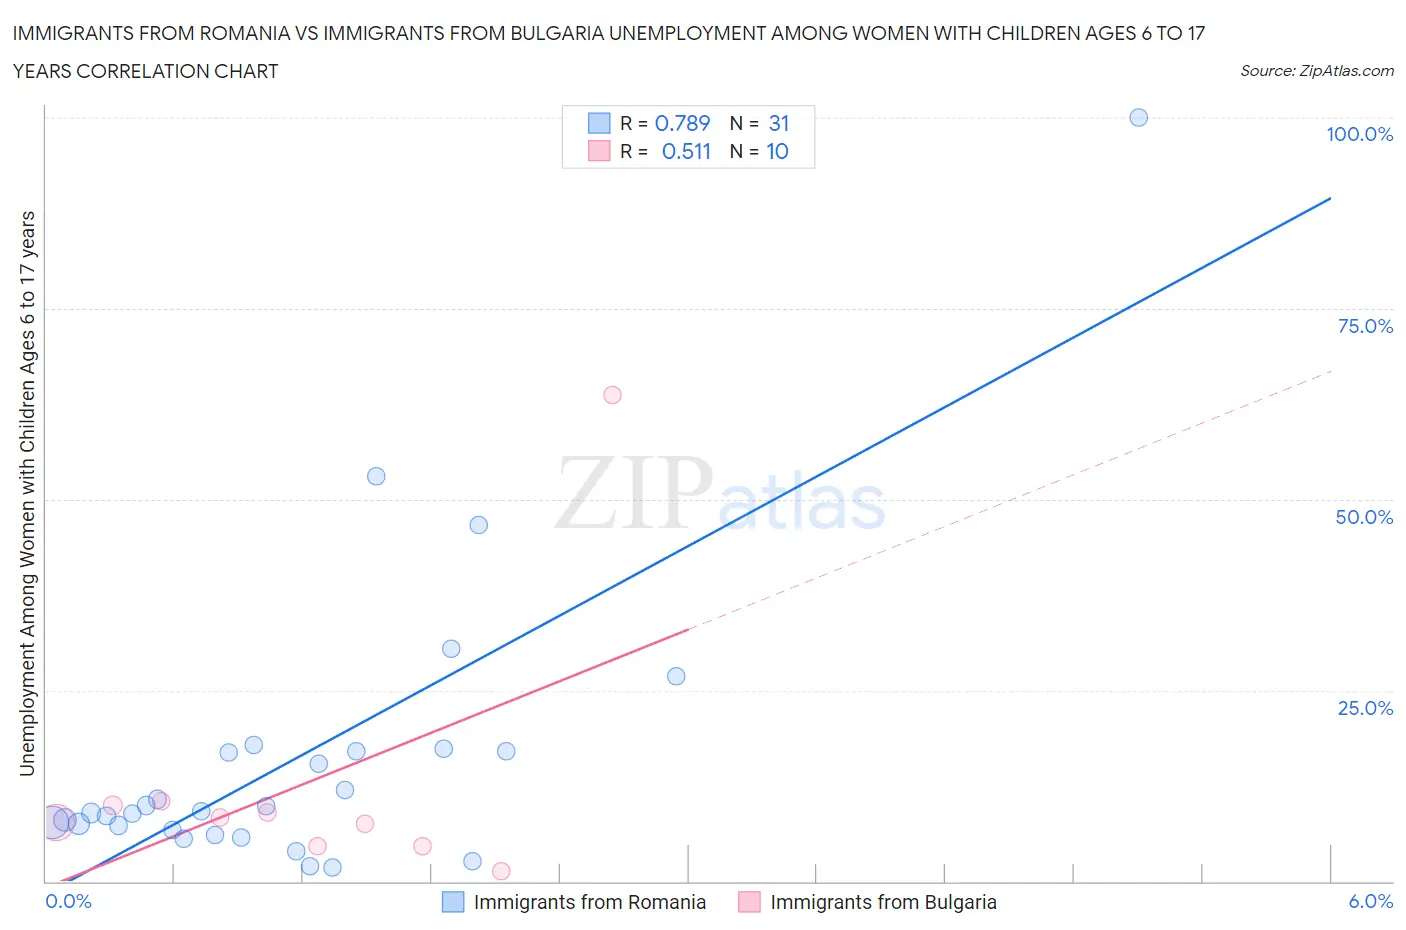
Immigrants from Romania vs Immigrants from Bulgaria Unemployment Among Women with Children Ages 6 to 17 years Correlation Chart
The statistical analysis conducted on geographies consisting of 195,503,585 people shows a strong positive correlation between the proportion of Immigrants from Romania and unemployment rate among women with children between the ages 6 and 17 in the United States with a correlation coefficient (R) of 0.789 and weighted average of 8.6%. Similarly, the statistical analysis conducted on geographies consisting of 140,311,007 people shows a substantial positive correlation between the proportion of Immigrants from Bulgaria and unemployment rate among women with children between the ages 6 and 17 in the United States with a correlation coefficient (R) of 0.511 and weighted average of 8.1%, a difference of 6.7%.
Unemployment Among Women with Children Ages 6 to 17 years Correlation Summary
| Measurement | Immigrants from Romania | Immigrants from Bulgaria |
| Minimum | 1.9% | 1.3% |
| Maximum | 100.0% | 63.6% |
| Range | 98.1% | 62.3% |
| Mean | 16.2% | 12.7% |
| Median | 9.2% | 8.0% |
| Interquartile 25% (IQ1) | 6.7% | 4.6% |
| Interquartile 75% (IQ3) | 17.1% | 10.0% |
| Interquartile Range (IQR) | 10.4% | 5.4% |
| Standard Deviation (Sample) | 19.5% | 18.1% |
| Standard Deviation (Population) | 19.2% | 17.2% |
Similar Demographics by Unemployment Among Women with Children Ages 6 to 17 years
Demographics Similar to Immigrants from Romania by Unemployment Among Women with Children Ages 6 to 17 years
In terms of unemployment among women with children ages 6 to 17 years, the demographic groups most similar to Immigrants from Romania are Latvian (8.6%, a difference of 0.010%), Immigrants from Ukraine (8.6%, a difference of 0.020%), Swedish (8.6%, a difference of 0.070%), Chickasaw (8.6%, a difference of 0.080%), and Immigrants from Serbia (8.6%, a difference of 0.11%).
| Demographics | Rating | Rank | Unemployment Among Women with Children Ages 6 to 17 years |
| Immigrants | South Africa | 98.3 /100 | #102 | Exceptional 8.6% |
| Scandinavians | 98.3 /100 | #103 | Exceptional 8.6% |
| Immigrants | France | 98.0 /100 | #104 | Exceptional 8.6% |
| Immigrants | Norway | 97.8 /100 | #105 | Exceptional 8.6% |
| Immigrants | Serbia | 97.7 /100 | #106 | Exceptional 8.6% |
| Chickasaw | 97.6 /100 | #107 | Exceptional 8.6% |
| Swedes | 97.6 /100 | #108 | Exceptional 8.6% |
| Immigrants | Romania | 97.5 /100 | #109 | Exceptional 8.6% |
| Latvians | 97.4 /100 | #110 | Exceptional 8.6% |
| Immigrants | Ukraine | 97.4 /100 | #111 | Exceptional 8.6% |
| Romanians | 97.1 /100 | #112 | Exceptional 8.6% |
| Eastern Europeans | 96.8 /100 | #113 | Exceptional 8.6% |
| Immigrants | Russia | 96.7 /100 | #114 | Exceptional 8.6% |
| Argentineans | 96.5 /100 | #115 | Exceptional 8.6% |
| Zimbabweans | 96.3 /100 | #116 | Exceptional 8.6% |
Demographics Similar to Immigrants from Bulgaria by Unemployment Among Women with Children Ages 6 to 17 years
In terms of unemployment among women with children ages 6 to 17 years, the demographic groups most similar to Immigrants from Bulgaria are Icelander (8.1%, a difference of 0.020%), Immigrants from Sweden (8.1%, a difference of 0.050%), Immigrants from Switzerland (8.1%, a difference of 0.060%), Bhutanese (8.1%, a difference of 0.080%), and Immigrants from Asia (8.1%, a difference of 0.18%).
| Demographics | Rating | Rank | Unemployment Among Women with Children Ages 6 to 17 years |
| Alsatians | 100.0 /100 | #38 | Exceptional 8.0% |
| Somalis | 100.0 /100 | #39 | Exceptional 8.0% |
| Immigrants | Zimbabwe | 100.0 /100 | #40 | Exceptional 8.0% |
| Iranians | 100.0 /100 | #41 | Exceptional 8.0% |
| Immigrants | Somalia | 100.0 /100 | #42 | Exceptional 8.0% |
| Bhutanese | 100.0 /100 | #43 | Exceptional 8.1% |
| Immigrants | Sweden | 100.0 /100 | #44 | Exceptional 8.1% |
| Immigrants | Bulgaria | 100.0 /100 | #45 | Exceptional 8.1% |
| Icelanders | 100.0 /100 | #46 | Exceptional 8.1% |
| Immigrants | Switzerland | 100.0 /100 | #47 | Exceptional 8.1% |
| Immigrants | Asia | 100.0 /100 | #48 | Exceptional 8.1% |
| Immigrants | Oceania | 100.0 /100 | #49 | Exceptional 8.1% |
| Hawaiians | 100.0 /100 | #50 | Exceptional 8.1% |
| Immigrants | Sudan | 100.0 /100 | #51 | Exceptional 8.1% |
| Immigrants | Iraq | 100.0 /100 | #52 | Exceptional 8.1% |