Sierra Leonean vs Yuman Disability Age 35 to 64
COMPARE
Sierra Leonean
Yuman
Disability Age 35 to 64
Disability Age 35 to 64 Comparison
Sierra Leoneans
Yuman
10.8%
DISABILITY AGE 35 TO 64
89.7/ 100
METRIC RATING
143rd/ 347
METRIC RANK
15.8%
DISABILITY AGE 35 TO 64
0.0/ 100
METRIC RATING
333rd/ 347
METRIC RANK
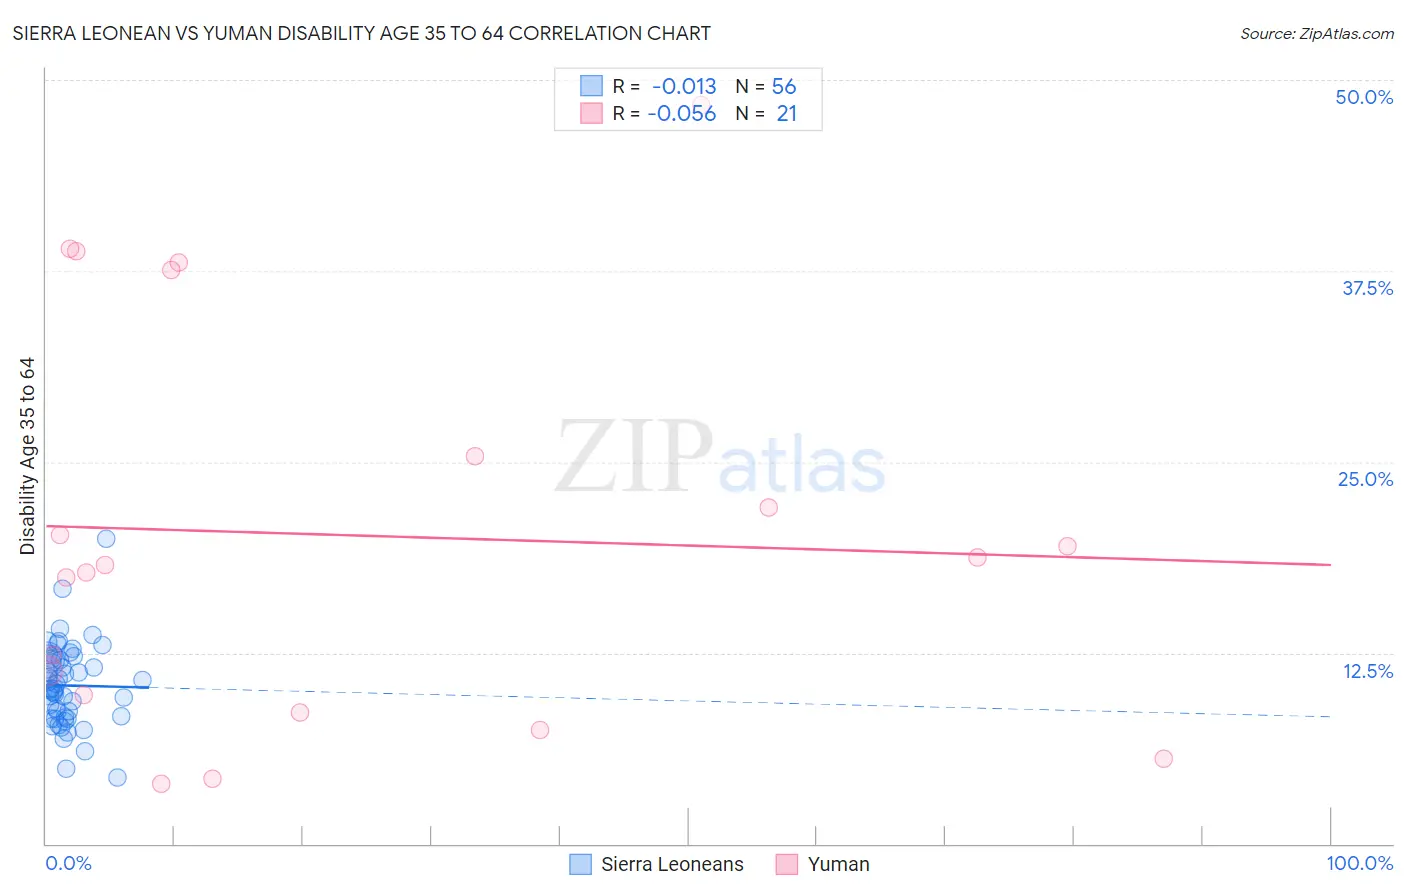
Sierra Leonean vs Yuman Disability Age 35 to 64 Correlation Chart
The statistical analysis conducted on geographies consisting of 83,310,916 people shows no correlation between the proportion of Sierra Leoneans and percentage of population with a disability between the ages 34 and 64 in the United States with a correlation coefficient (R) of -0.013 and weighted average of 10.8%. Similarly, the statistical analysis conducted on geographies consisting of 40,663,205 people shows a slight negative correlation between the proportion of Yuman and percentage of population with a disability between the ages 34 and 64 in the United States with a correlation coefficient (R) of -0.056 and weighted average of 15.8%, a difference of 46.6%.
Disability Age 35 to 64 Correlation Summary
| Measurement | Sierra Leonean | Yuman |
| Minimum | 4.4% | 3.9% |
| Maximum | 20.0% | 48.4% |
| Range | 15.6% | 44.5% |
| Mean | 10.4% | 20.2% |
| Median | 10.1% | 18.2% |
| Interquartile 25% (IQ1) | 8.3% | 9.2% |
| Interquartile 75% (IQ3) | 12.1% | 31.5% |
| Interquartile Range (IQR) | 3.8% | 22.3% |
| Standard Deviation (Sample) | 2.7% | 13.1% |
| Standard Deviation (Population) | 2.7% | 12.8% |
Similar Demographics by Disability Age 35 to 64
Demographics Similar to Sierra Leoneans by Disability Age 35 to 64
In terms of disability age 35 to 64, the demographic groups most similar to Sierra Leoneans are Immigrants from Saudi Arabia (10.8%, a difference of 0.21%), Lithuanian (10.8%, a difference of 0.21%), Australian (10.8%, a difference of 0.25%), Immigrants from Scotland (10.7%, a difference of 0.38%), and Costa Rican (10.7%, a difference of 0.43%).
| Demographics | Rating | Rank | Disability Age 35 to 64 |
| Salvadorans | 91.9 /100 | #136 | Exceptional 10.7% |
| Immigrants | Costa Rica | 91.7 /100 | #137 | Exceptional 10.7% |
| Immigrants | Southern Europe | 91.5 /100 | #138 | Exceptional 10.7% |
| Costa Ricans | 91.4 /100 | #139 | Exceptional 10.7% |
| Immigrants | Scotland | 91.3 /100 | #140 | Exceptional 10.7% |
| Australians | 90.7 /100 | #141 | Exceptional 10.8% |
| Immigrants | Saudi Arabia | 90.6 /100 | #142 | Exceptional 10.8% |
| Sierra Leoneans | 89.7 /100 | #143 | Excellent 10.8% |
| Lithuanians | 88.7 /100 | #144 | Excellent 10.8% |
| Immigrants | Bangladesh | 85.6 /100 | #145 | Excellent 10.9% |
| South American Indians | 83.5 /100 | #146 | Excellent 10.9% |
| Immigrants | Eritrea | 83.4 /100 | #147 | Excellent 10.9% |
| Arabs | 82.7 /100 | #148 | Excellent 10.9% |
| Immigrants | Cameroon | 81.1 /100 | #149 | Excellent 10.9% |
| Syrians | 79.8 /100 | #150 | Good 11.0% |
Demographics Similar to Yuman by Disability Age 35 to 64
In terms of disability age 35 to 64, the demographic groups most similar to Yuman are Colville (15.8%, a difference of 0.19%), Seminole (15.9%, a difference of 0.30%), Menominee (15.9%, a difference of 0.53%), Alaskan Athabascan (15.7%, a difference of 0.55%), and Puerto Rican (15.9%, a difference of 0.85%).
| Demographics | Rating | Rank | Disability Age 35 to 64 |
| Natives/Alaskans | 0.0 /100 | #326 | Tragic 15.3% |
| Pueblo | 0.0 /100 | #327 | Tragic 15.3% |
| Cajuns | 0.0 /100 | #328 | Tragic 15.3% |
| Cherokee | 0.0 /100 | #329 | Tragic 15.5% |
| Navajo | 0.0 /100 | #330 | Tragic 15.5% |
| Dutch West Indians | 0.0 /100 | #331 | Tragic 15.6% |
| Alaskan Athabascans | 0.0 /100 | #332 | Tragic 15.7% |
| Yuman | 0.0 /100 | #333 | Tragic 15.8% |
| Colville | 0.0 /100 | #334 | Tragic 15.8% |
| Seminole | 0.0 /100 | #335 | Tragic 15.9% |
| Menominee | 0.0 /100 | #336 | Tragic 15.9% |
| Puerto Ricans | 0.0 /100 | #337 | Tragic 15.9% |
| Chickasaw | 0.0 /100 | #338 | Tragic 16.1% |
| Pima | 0.0 /100 | #339 | Tragic 16.1% |
| Choctaw | 0.0 /100 | #340 | Tragic 16.4% |