Bahamian vs Aleut Unemployment Among Ages 55 to 59 years
COMPARE
Bahamian
Aleut
Unemployment Among Ages 55 to 59 years
Unemployment Among Ages 55 to 59 years Comparison
Bahamians
Aleuts
4.8%
UNEMPLOYMENT AMONG AGES 55 TO 59 YEARS
68.6/ 100
METRIC RATING
151st/ 347
METRIC RANK
6.4%
UNEMPLOYMENT AMONG AGES 55 TO 59 YEARS
0.0/ 100
METRIC RATING
332nd/ 347
METRIC RANK
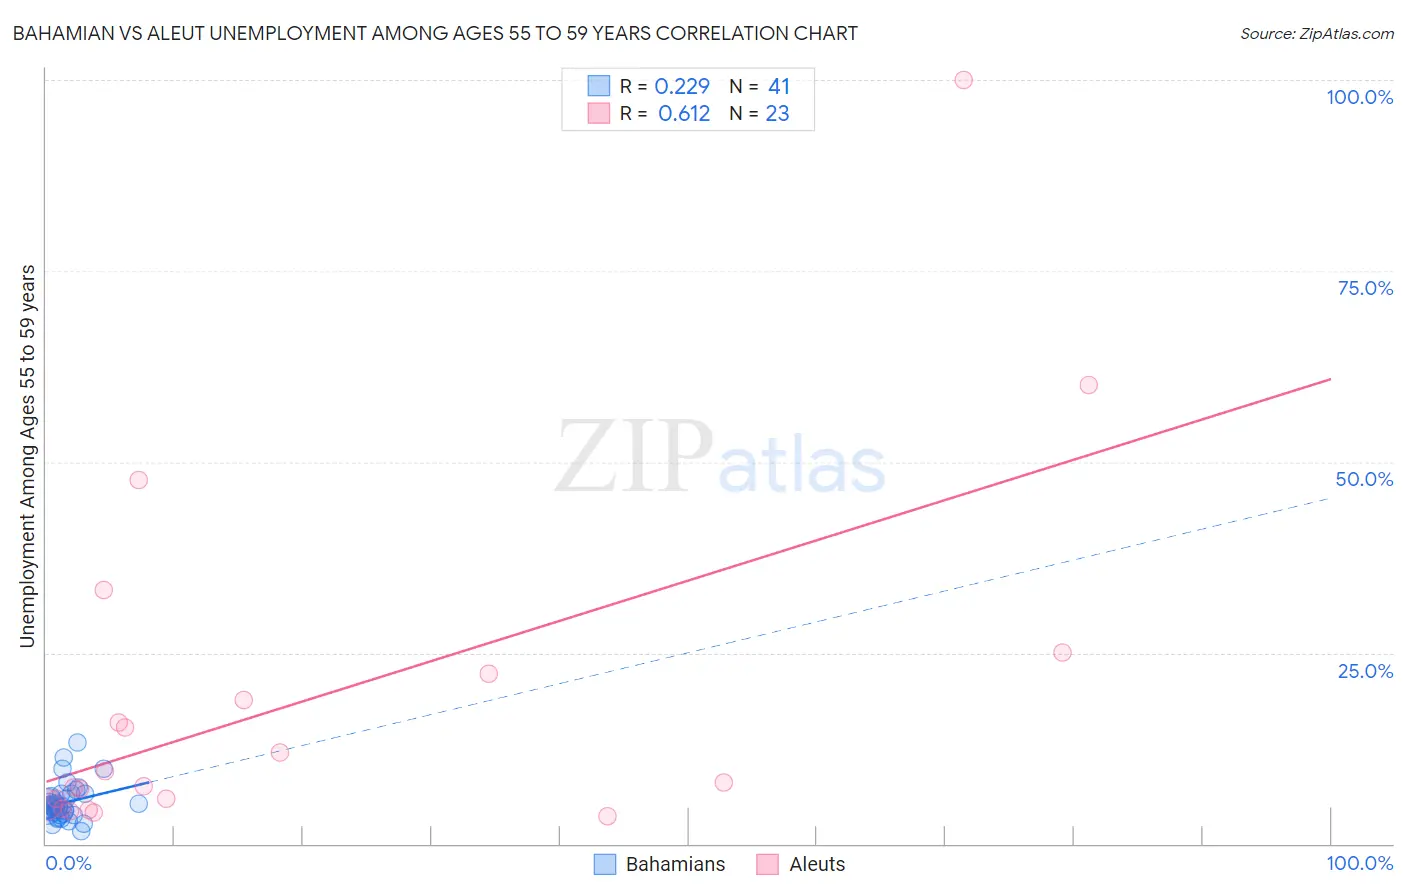
Bahamian vs Aleut Unemployment Among Ages 55 to 59 years Correlation Chart
The statistical analysis conducted on geographies consisting of 109,551,111 people shows a weak positive correlation between the proportion of Bahamians and unemployment rate among population between the ages 55 and 59 in the United States with a correlation coefficient (R) of 0.229 and weighted average of 4.8%. Similarly, the statistical analysis conducted on geographies consisting of 60,136,595 people shows a significant positive correlation between the proportion of Aleuts and unemployment rate among population between the ages 55 and 59 in the United States with a correlation coefficient (R) of 0.612 and weighted average of 6.4%, a difference of 34.7%.
Unemployment Among Ages 55 to 59 years Correlation Summary
| Measurement | Bahamian | Aleut |
| Minimum | 1.6% | 3.6% |
| Maximum | 13.2% | 100.0% |
| Range | 11.6% | 96.4% |
| Mean | 5.4% | 18.6% |
| Median | 4.9% | 8.0% |
| Interquartile 25% (IQ1) | 4.0% | 5.1% |
| Interquartile 75% (IQ3) | 6.3% | 22.2% |
| Interquartile Range (IQR) | 2.3% | 17.1% |
| Standard Deviation (Sample) | 2.3% | 23.0% |
| Standard Deviation (Population) | 2.3% | 22.5% |
Similar Demographics by Unemployment Among Ages 55 to 59 years
Demographics Similar to Bahamians by Unemployment Among Ages 55 to 59 years
In terms of unemployment among ages 55 to 59 years, the demographic groups most similar to Bahamians are Laotian (4.8%, a difference of 0.020%), Immigrants from Northern Africa (4.8%, a difference of 0.060%), Immigrants from Uruguay (4.8%, a difference of 0.060%), Immigrants from Panama (4.8%, a difference of 0.080%), and Immigrants from Lithuania (4.8%, a difference of 0.11%).
| Demographics | Rating | Rank | Unemployment Among Ages 55 to 59 years |
| Immigrants | Asia | 77.8 /100 | #144 | Good 4.8% |
| Immigrants | Northern Europe | 77.5 /100 | #145 | Good 4.8% |
| Immigrants | South Eastern Asia | 77.4 /100 | #146 | Good 4.8% |
| Immigrants | Singapore | 76.6 /100 | #147 | Good 4.8% |
| Immigrants | Bahamas | 71.8 /100 | #148 | Good 4.8% |
| Immigrants | Lithuania | 70.8 /100 | #149 | Good 4.8% |
| Immigrants | Northern Africa | 69.8 /100 | #150 | Good 4.8% |
| Bahamians | 68.6 /100 | #151 | Good 4.8% |
| Laotians | 68.2 /100 | #152 | Good 4.8% |
| Immigrants | Uruguay | 67.2 /100 | #153 | Good 4.8% |
| Immigrants | Panama | 66.8 /100 | #154 | Good 4.8% |
| Immigrants | North Macedonia | 66.3 /100 | #155 | Good 4.8% |
| Italians | 66.2 /100 | #156 | Good 4.8% |
| Carpatho Rusyns | 66.0 /100 | #157 | Good 4.8% |
| Slovaks | 65.3 /100 | #158 | Good 4.8% |
Demographics Similar to Aleuts by Unemployment Among Ages 55 to 59 years
In terms of unemployment among ages 55 to 59 years, the demographic groups most similar to Aleuts are Immigrants from Dominican Republic (6.3%, a difference of 2.4%), Pima (6.6%, a difference of 2.8%), Alaska Native (6.2%, a difference of 3.1%), Dominican (6.2%, a difference of 3.6%), and Pueblo (6.7%, a difference of 4.1%).
| Demographics | Rating | Rank | Unemployment Among Ages 55 to 59 years |
| Immigrants | Armenia | 0.0 /100 | #325 | Tragic 6.0% |
| Natives/Alaskans | 0.0 /100 | #326 | Tragic 6.0% |
| Arapaho | 0.0 /100 | #327 | Tragic 6.1% |
| Yuman | 0.0 /100 | #328 | Tragic 6.1% |
| Dominicans | 0.0 /100 | #329 | Tragic 6.2% |
| Alaska Natives | 0.0 /100 | #330 | Tragic 6.2% |
| Immigrants | Dominican Republic | 0.0 /100 | #331 | Tragic 6.3% |
| Aleuts | 0.0 /100 | #332 | Tragic 6.4% |
| Pima | 0.0 /100 | #333 | Tragic 6.6% |
| Pueblo | 0.0 /100 | #334 | Tragic 6.7% |
| Colville | 0.0 /100 | #335 | Tragic 6.7% |
| Navajo | 0.0 /100 | #336 | Tragic 6.7% |
| Paiute | 0.0 /100 | #337 | Tragic 6.8% |
| Immigrants | Yemen | 0.0 /100 | #338 | Tragic 6.9% |
| Puerto Ricans | 0.0 /100 | #339 | Tragic 7.0% |