Immigrants from Dominica vs Portuguese Unemployment Among Ages 25 to 29 years
COMPARE
Immigrants from Dominica
Portuguese
Unemployment Among Ages 25 to 29 years
Unemployment Among Ages 25 to 29 years Comparison
Immigrants from Dominica
Portuguese
8.4%
UNEMPLOYMENT AMONG AGES 25 TO 29 YEARS
0.0/ 100
METRIC RATING
314th/ 347
METRIC RANK
7.2%
UNEMPLOYMENT AMONG AGES 25 TO 29 YEARS
0.5/ 100
METRIC RATING
251st/ 347
METRIC RANK
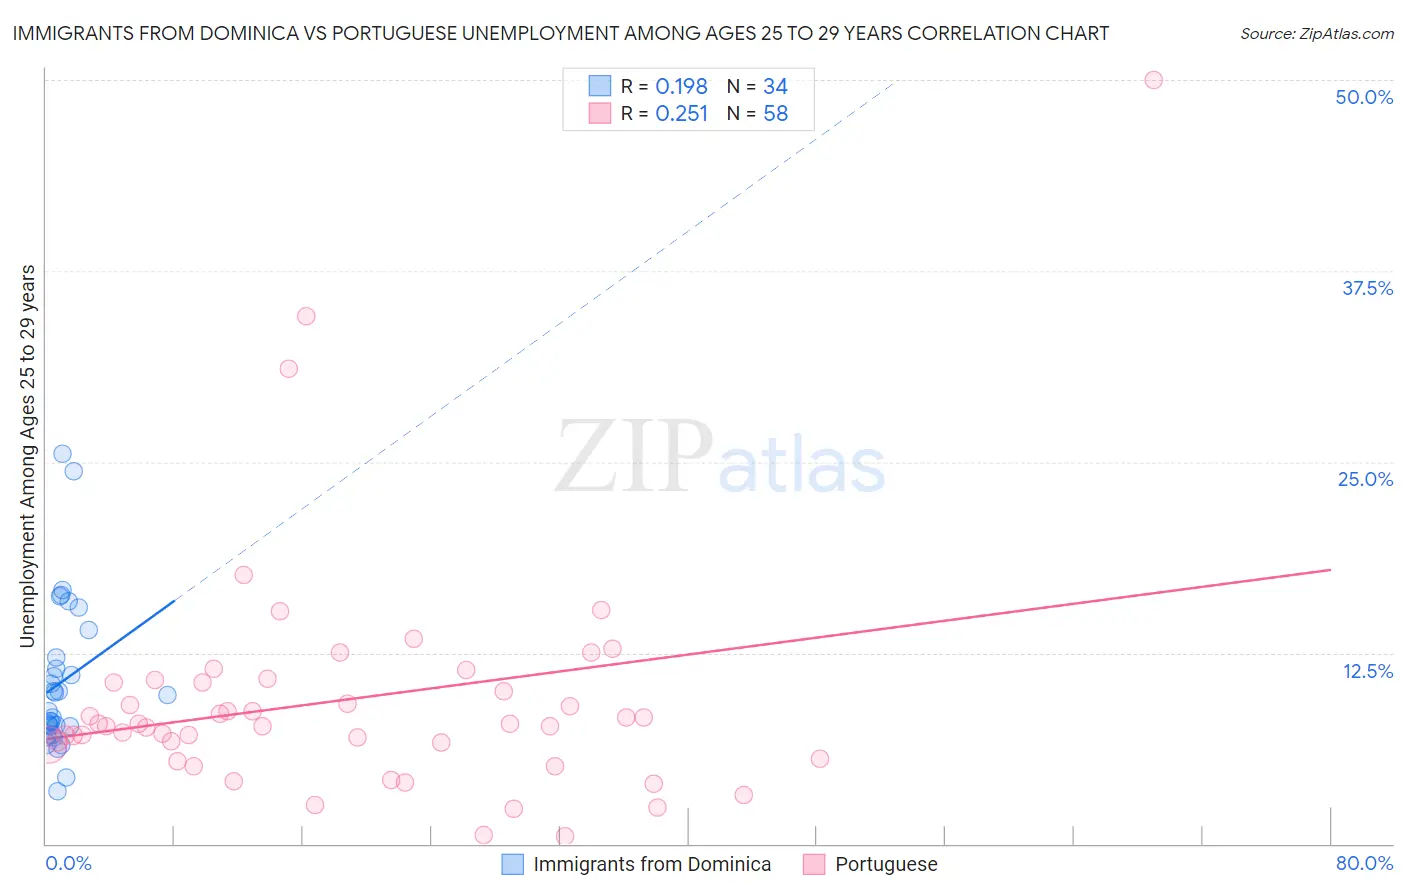
Immigrants from Dominica vs Portuguese Unemployment Among Ages 25 to 29 years Correlation Chart
The statistical analysis conducted on geographies consisting of 82,940,990 people shows a poor positive correlation between the proportion of Immigrants from Dominica and unemployment rate among population between the ages 25 and 29 in the United States with a correlation coefficient (R) of 0.198 and weighted average of 8.4%. Similarly, the statistical analysis conducted on geographies consisting of 421,376,294 people shows a weak positive correlation between the proportion of Portuguese and unemployment rate among population between the ages 25 and 29 in the United States with a correlation coefficient (R) of 0.251 and weighted average of 7.2%, a difference of 16.8%.
Unemployment Among Ages 25 to 29 years Correlation Summary
| Measurement | Immigrants from Dominica | Portuguese |
| Minimum | 3.4% | 0.50% |
| Maximum | 25.5% | 50.0% |
| Range | 22.1% | 49.5% |
| Mean | 10.6% | 9.5% |
| Median | 9.2% | 7.8% |
| Interquartile 25% (IQ1) | 7.7% | 6.5% |
| Interquartile 75% (IQ3) | 12.2% | 10.6% |
| Interquartile Range (IQR) | 4.5% | 4.1% |
| Standard Deviation (Sample) | 5.0% | 7.9% |
| Standard Deviation (Population) | 4.9% | 7.8% |
Similar Demographics by Unemployment Among Ages 25 to 29 years
Demographics Similar to Immigrants from Dominica by Unemployment Among Ages 25 to 29 years
In terms of unemployment among ages 25 to 29 years, the demographic groups most similar to Immigrants from Dominica are Immigrants from St. Vincent and the Grenadines (8.4%, a difference of 0.35%), British West Indian (8.4%, a difference of 0.59%), Immigrants from Grenada (8.4%, a difference of 0.66%), Immigrants from Guyana (8.5%, a difference of 0.75%), and Guyanese (8.5%, a difference of 1.0%).
| Demographics | Rating | Rank | Unemployment Among Ages 25 to 29 years |
| Immigrants | Barbados | 0.0 /100 | #307 | Tragic 8.0% |
| Immigrants | Jamaica | 0.0 /100 | #308 | Tragic 8.1% |
| Immigrants | Haiti | 0.0 /100 | #309 | Tragic 8.1% |
| U.S. Virgin Islanders | 0.0 /100 | #310 | Tragic 8.1% |
| Immigrants | Azores | 0.0 /100 | #311 | Tragic 8.1% |
| Dutch West Indians | 0.0 /100 | #312 | Tragic 8.2% |
| Immigrants | St. Vincent and the Grenadines | 0.0 /100 | #313 | Tragic 8.4% |
| Immigrants | Dominica | 0.0 /100 | #314 | Tragic 8.4% |
| British West Indians | 0.0 /100 | #315 | Tragic 8.4% |
| Immigrants | Grenada | 0.0 /100 | #316 | Tragic 8.4% |
| Immigrants | Guyana | 0.0 /100 | #317 | Tragic 8.5% |
| Guyanese | 0.0 /100 | #318 | Tragic 8.5% |
| Immigrants | Armenia | 0.0 /100 | #319 | Tragic 8.5% |
| Blacks/African Americans | 0.0 /100 | #320 | Tragic 8.6% |
| Immigrants | Dominican Republic | 0.0 /100 | #321 | Tragic 8.6% |
Demographics Similar to Portuguese by Unemployment Among Ages 25 to 29 years
In terms of unemployment among ages 25 to 29 years, the demographic groups most similar to Portuguese are Delaware (7.2%, a difference of 0.060%), Seminole (7.2%, a difference of 0.22%), Subsaharan African (7.2%, a difference of 0.25%), Sierra Leonean (7.2%, a difference of 0.26%), and Immigrants from Guatemala (7.2%, a difference of 0.41%).
| Demographics | Rating | Rank | Unemployment Among Ages 25 to 29 years |
| Immigrants | Nonimmigrants | 0.9 /100 | #244 | Tragic 7.1% |
| Guatemalans | 0.9 /100 | #245 | Tragic 7.1% |
| Immigrants | Uzbekistan | 0.7 /100 | #246 | Tragic 7.2% |
| Immigrants | Guatemala | 0.7 /100 | #247 | Tragic 7.2% |
| Sub-Saharan Africans | 0.6 /100 | #248 | Tragic 7.2% |
| Seminole | 0.6 /100 | #249 | Tragic 7.2% |
| Delaware | 0.5 /100 | #250 | Tragic 7.2% |
| Portuguese | 0.5 /100 | #251 | Tragic 7.2% |
| Sierra Leoneans | 0.4 /100 | #252 | Tragic 7.2% |
| Immigrants | Portugal | 0.3 /100 | #253 | Tragic 7.2% |
| Ghanaians | 0.3 /100 | #254 | Tragic 7.2% |
| Immigrants | Cameroon | 0.3 /100 | #255 | Tragic 7.2% |
| Mexican American Indians | 0.3 /100 | #256 | Tragic 7.3% |
| Assyrians/Chaldeans/Syriacs | 0.2 /100 | #257 | Tragic 7.3% |
| Ottawa | 0.1 /100 | #258 | Tragic 7.3% |