Serbian vs Immigrants from Iran Male Unemployment
COMPARE
Serbian
Immigrants from Iran
Male Unemployment
Male Unemployment Comparison
Serbians
Immigrants from Iran
5.1%
MALE UNEMPLOYMENT
95.7/ 100
METRIC RATING
84th/ 347
METRIC RANK
5.3%
MALE UNEMPLOYMENT
50.0/ 100
METRIC RATING
174th/ 347
METRIC RANK
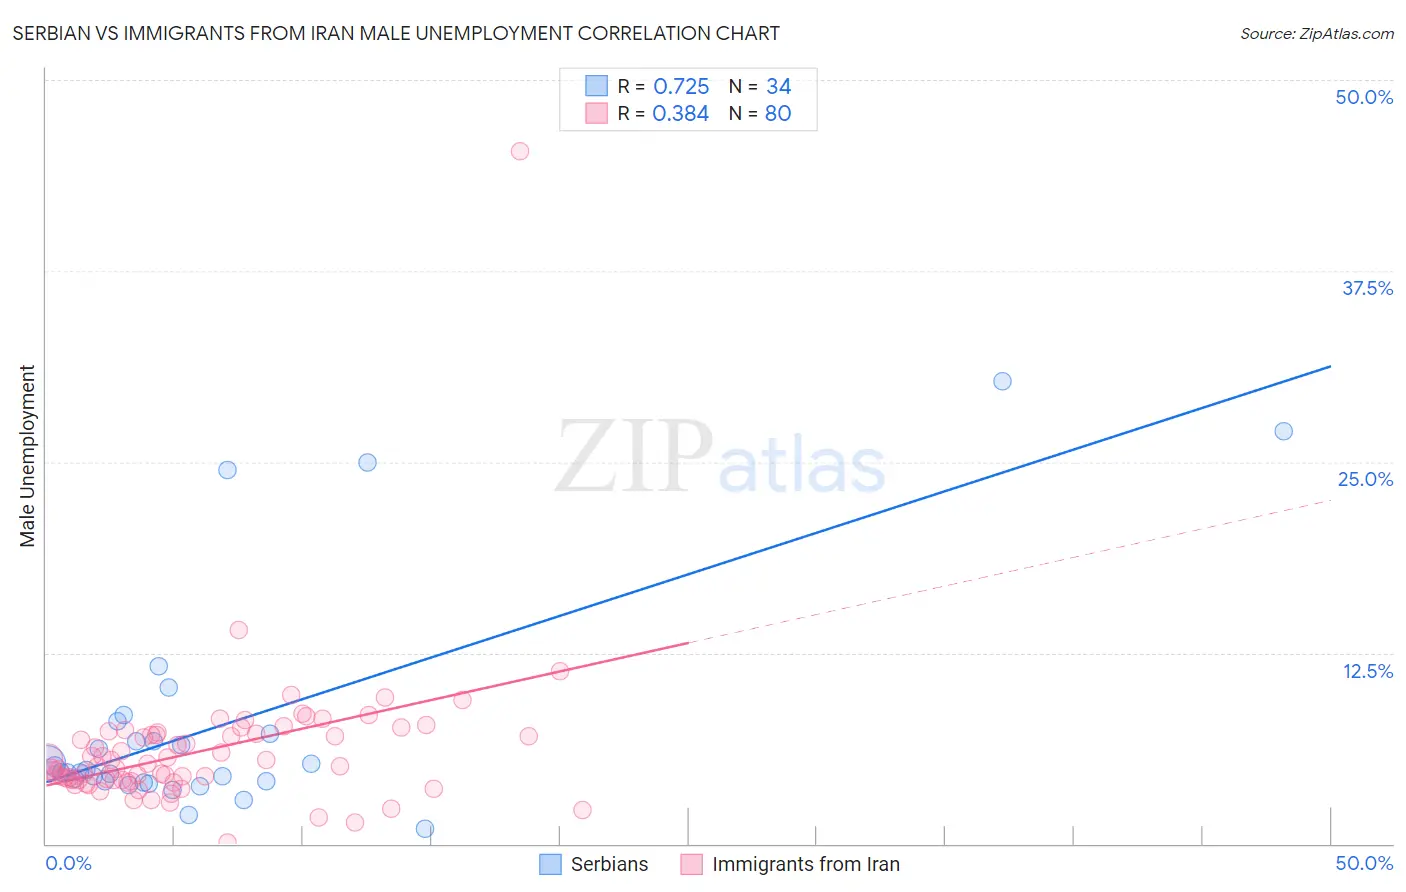
Serbian vs Immigrants from Iran Male Unemployment Correlation Chart
The statistical analysis conducted on geographies consisting of 266,907,667 people shows a strong positive correlation between the proportion of Serbians and unemployment rate among males in the United States with a correlation coefficient (R) of 0.725 and weighted average of 5.1%. Similarly, the statistical analysis conducted on geographies consisting of 279,526,020 people shows a mild positive correlation between the proportion of Immigrants from Iran and unemployment rate among males in the United States with a correlation coefficient (R) of 0.384 and weighted average of 5.3%, a difference of 4.8%.
Male Unemployment Correlation Summary
| Measurement | Serbian | Immigrants from Iran |
| Minimum | 1.0% | 0.10% |
| Maximum | 30.3% | 45.3% |
| Range | 29.3% | 45.2% |
| Mean | 7.7% | 6.1% |
| Median | 4.8% | 5.1% |
| Interquartile 25% (IQ1) | 4.1% | 4.2% |
| Interquartile 75% (IQ3) | 7.2% | 7.2% |
| Interquartile Range (IQR) | 3.1% | 3.0% |
| Standard Deviation (Sample) | 7.4% | 5.0% |
| Standard Deviation (Population) | 7.3% | 5.0% |
Similar Demographics by Male Unemployment
Demographics Similar to Serbians by Male Unemployment
In terms of male unemployment, the demographic groups most similar to Serbians are Immigrants from North Macedonia (5.1%, a difference of 0.050%), Maltese (5.1%, a difference of 0.090%), Immigrants from Romania (5.1%, a difference of 0.11%), Immigrants from Eritrea (5.0%, a difference of 0.12%), and Chilean (5.0%, a difference of 0.17%).
| Demographics | Rating | Rank | Male Unemployment |
| Iranians | 96.4 /100 | #77 | Exceptional 5.0% |
| Immigrants | Northern Europe | 96.4 /100 | #78 | Exceptional 5.0% |
| South Africans | 96.4 /100 | #79 | Exceptional 5.0% |
| Argentineans | 96.2 /100 | #80 | Exceptional 5.0% |
| French | 96.2 /100 | #81 | Exceptional 5.0% |
| Chileans | 96.2 /100 | #82 | Exceptional 5.0% |
| Immigrants | Eritrea | 96.0 /100 | #83 | Exceptional 5.0% |
| Serbians | 95.7 /100 | #84 | Exceptional 5.1% |
| Immigrants | North Macedonia | 95.6 /100 | #85 | Exceptional 5.1% |
| Maltese | 95.5 /100 | #86 | Exceptional 5.1% |
| Immigrants | Romania | 95.4 /100 | #87 | Exceptional 5.1% |
| Immigrants | Sri Lanka | 94.9 /100 | #88 | Exceptional 5.1% |
| Immigrants | Australia | 94.7 /100 | #89 | Exceptional 5.1% |
| Okinawans | 94.7 /100 | #90 | Exceptional 5.1% |
| Immigrants | Turkey | 94.4 /100 | #91 | Exceptional 5.1% |
Demographics Similar to Immigrants from Iran by Male Unemployment
In terms of male unemployment, the demographic groups most similar to Immigrants from Iran are Immigrants from Russia (5.3%, a difference of 0.040%), Immigrants from Kazakhstan (5.3%, a difference of 0.050%), Peruvian (5.3%, a difference of 0.11%), Immigrants from Iraq (5.3%, a difference of 0.11%), and Immigrants from Poland (5.3%, a difference of 0.23%).
| Demographics | Rating | Rank | Male Unemployment |
| Immigrants | Vietnam | 58.1 /100 | #167 | Average 5.3% |
| Immigrants | Ireland | 57.7 /100 | #168 | Average 5.3% |
| Immigrants | Congo | 57.4 /100 | #169 | Average 5.3% |
| Immigrants | Eastern Europe | 54.1 /100 | #170 | Average 5.3% |
| Peruvians | 51.9 /100 | #171 | Average 5.3% |
| Immigrants | Kazakhstan | 50.8 /100 | #172 | Average 5.3% |
| Immigrants | Russia | 50.7 /100 | #173 | Average 5.3% |
| Immigrants | Iran | 50.0 /100 | #174 | Average 5.3% |
| Immigrants | Iraq | 48.1 /100 | #175 | Average 5.3% |
| Immigrants | Poland | 46.0 /100 | #176 | Average 5.3% |
| Immigrants | Peru | 44.6 /100 | #177 | Average 5.3% |
| Osage | 42.5 /100 | #178 | Average 5.3% |
| Immigrants | Oceania | 40.8 /100 | #179 | Average 5.3% |
| Malaysians | 39.6 /100 | #180 | Fair 5.3% |
| Immigrants | Afghanistan | 37.9 /100 | #181 | Fair 5.3% |