Immigrants from Cameroon vs Immigrants from West Indies Unemployment Among Ages 45 to 54 years
COMPARE
Immigrants from Cameroon
Immigrants from West Indies
Unemployment Among Ages 45 to 54 years
Unemployment Among Ages 45 to 54 years Comparison
Immigrants from Cameroon
Immigrants from West Indies
4.4%
UNEMPLOYMENT AMONG AGES 45 TO 54 YEARS
84.8/ 100
METRIC RATING
133rd/ 347
METRIC RANK
5.4%
UNEMPLOYMENT AMONG AGES 45 TO 54 YEARS
0.0/ 100
METRIC RATING
305th/ 347
METRIC RANK
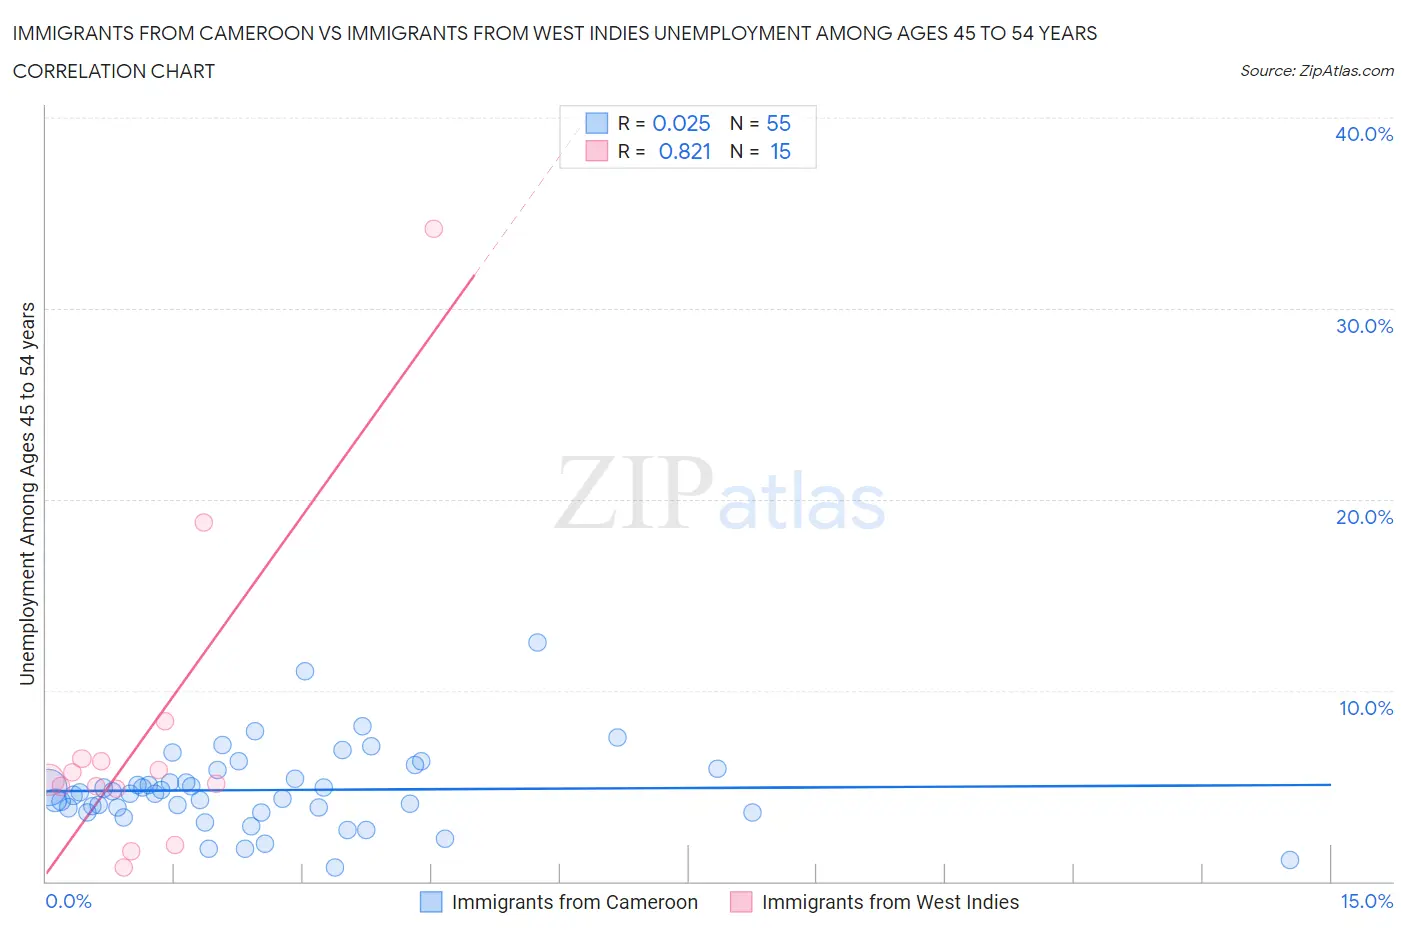
Immigrants from Cameroon vs Immigrants from West Indies Unemployment Among Ages 45 to 54 years Correlation Chart
The statistical analysis conducted on geographies consisting of 129,893,424 people shows no correlation between the proportion of Immigrants from Cameroon and unemployment rate among population between the ages 45 and 54 in the United States with a correlation coefficient (R) of 0.025 and weighted average of 4.4%. Similarly, the statistical analysis conducted on geographies consisting of 72,252,294 people shows a very strong positive correlation between the proportion of Immigrants from West Indies and unemployment rate among population between the ages 45 and 54 in the United States with a correlation coefficient (R) of 0.821 and weighted average of 5.4%, a difference of 21.0%.
Unemployment Among Ages 45 to 54 years Correlation Summary
| Measurement | Immigrants from Cameroon | Immigrants from West Indies |
| Minimum | 0.70% | 0.71% |
| Maximum | 12.5% | 34.2% |
| Range | 11.8% | 33.5% |
| Mean | 4.8% | 7.7% |
| Median | 4.6% | 5.3% |
| Interquartile 25% (IQ1) | 3.6% | 4.8% |
| Interquartile 75% (IQ3) | 5.8% | 6.4% |
| Interquartile Range (IQR) | 2.2% | 1.6% |
| Standard Deviation (Sample) | 2.1% | 8.4% |
| Standard Deviation (Population) | 2.1% | 8.1% |
Similar Demographics by Unemployment Among Ages 45 to 54 years
Demographics Similar to Immigrants from Cameroon by Unemployment Among Ages 45 to 54 years
In terms of unemployment among ages 45 to 54 years, the demographic groups most similar to Immigrants from Cameroon are Afghan (4.4%, a difference of 0.020%), Immigrants from Eastern Africa (4.4%, a difference of 0.030%), Immigrants from Eastern Asia (4.4%, a difference of 0.070%), Immigrants from Germany (4.4%, a difference of 0.10%), and Celtic (4.4%, a difference of 0.13%).
| Demographics | Rating | Rank | Unemployment Among Ages 45 to 54 years |
| Immigrants | Czechoslovakia | 87.8 /100 | #126 | Excellent 4.4% |
| Nicaraguans | 87.6 /100 | #127 | Excellent 4.4% |
| Immigrants | Northern Europe | 86.9 /100 | #128 | Excellent 4.4% |
| Laotians | 86.3 /100 | #129 | Excellent 4.4% |
| Celtics | 86.2 /100 | #130 | Excellent 4.4% |
| Immigrants | Germany | 85.9 /100 | #131 | Excellent 4.4% |
| Immigrants | Eastern Africa | 85.1 /100 | #132 | Excellent 4.4% |
| Immigrants | Cameroon | 84.8 /100 | #133 | Excellent 4.4% |
| Afghans | 84.6 /100 | #134 | Excellent 4.4% |
| Immigrants | Eastern Asia | 84.0 /100 | #135 | Excellent 4.4% |
| Immigrants | Middle Africa | 83.3 /100 | #136 | Excellent 4.4% |
| Lebanese | 81.9 /100 | #137 | Excellent 4.4% |
| Immigrants | Congo | 81.8 /100 | #138 | Excellent 4.4% |
| Immigrants | Kuwait | 81.7 /100 | #139 | Excellent 4.4% |
| Immigrants | Zaire | 80.7 /100 | #140 | Excellent 4.4% |
Demographics Similar to Immigrants from West Indies by Unemployment Among Ages 45 to 54 years
In terms of unemployment among ages 45 to 54 years, the demographic groups most similar to Immigrants from West Indies are Immigrants from Bangladesh (5.4%, a difference of 0.16%), Immigrants from Jamaica (5.4%, a difference of 0.17%), Immigrants from Belize (5.3%, a difference of 0.35%), Vietnamese (5.4%, a difference of 0.42%), and Immigrants from Ecuador (5.3%, a difference of 0.45%).
| Demographics | Rating | Rank | Unemployment Among Ages 45 to 54 years |
| Immigrants | Trinidad and Tobago | 0.0 /100 | #298 | Tragic 5.3% |
| Ecuadorians | 0.0 /100 | #299 | Tragic 5.3% |
| Central American Indians | 0.0 /100 | #300 | Tragic 5.3% |
| Menominee | 0.0 /100 | #301 | Tragic 5.3% |
| Immigrants | Ecuador | 0.0 /100 | #302 | Tragic 5.3% |
| Immigrants | Belize | 0.0 /100 | #303 | Tragic 5.3% |
| Immigrants | Jamaica | 0.0 /100 | #304 | Tragic 5.4% |
| Immigrants | West Indies | 0.0 /100 | #305 | Tragic 5.4% |
| Immigrants | Bangladesh | 0.0 /100 | #306 | Tragic 5.4% |
| Vietnamese | 0.0 /100 | #307 | Tragic 5.4% |
| Blacks/African Americans | 0.0 /100 | #308 | Tragic 5.4% |
| Barbadians | 0.0 /100 | #309 | Tragic 5.5% |
| Immigrants | Barbados | 0.0 /100 | #310 | Tragic 5.5% |
| Chippewa | 0.0 /100 | #311 | Tragic 5.5% |
| Immigrants | Grenada | 0.0 /100 | #312 | Tragic 5.6% |