Seminole vs Immigrants from South Africa Unemployment Among Women with Children Under 6 years

COMPARE

Seminole
Race
Ancestry
AfghanAfricanAlaska NativeAlaskan AthabascanAlbanianAleutAlsatianAmericanApacheArabArapahoArgentineanArmenianAssyrian/Chaldean/SyriacAustralianAustrianBahamianBangladeshiBarbadianBasqueBelgianBelizeanBermudanBhutaneseBlackfeetBolivianBrazilianBritishBritish West IndianBulgarianBurmeseCajunCambodianCanadianCape VerdeanCarpatho RusynCelticCentral AmericanCentral American IndianCherokeeCheyenneChickasawChileanChineseChippewaChoctawColombianColvilleComancheCosta RicanCreeCreekCroatianCrowCubanCypriotCzechCzechoslovakianDanishDelawareDominicanDutchDutch West IndianEastern EuropeanEcuadorianEgyptianEnglishEstonianEthiopianEuropeanFijianFilipinoFinnishFrenchFrench American IndianFrench CanadianGermanGerman RussianGhanaianGreekGuamanian/ChamorroGuatemalanGuyaneseHaitianHmongHonduranHopiHoumaHungarianIcelanderIndian (Asian)IndonesianInupiatIranianIraqiIrishIroquoisIsraeliItalianJamaicanJapaneseJordanianKenyanKiowaKoreanLaotianLatvianLebaneseLiberianLithuanianLumbeeLuxembourgerMacedonianMalaysianMalteseMarshalleseMenomineeMexicanMexican American IndianMongolianMoroccanNative HawaiianNavajoNepaleseNew ZealanderNicaraguanNigerianNorthern EuropeanNorwegianOkinawanOsageOttawaPaiutePakistaniPalestinianPanamanianParaguayanPennsylvania GermanPeruvianPimaPolishPortuguesePotawatomiPuebloPuerto RicanPuget Sound SalishRomanianRussianSalvadoranSamoanScandinavianScotch-IrishScottishSeminoleSenegaleseSerbianShoshoneSierra LeoneanSiouxSlavicSlovakSloveneSomaliSouth AfricanSouth AmericanSouth American IndianSoviet UnionSpaniardSpanishSpanish AmericanSpanish American IndianSri LankanSubsaharan AfricanSudaneseSwedishSwissSyrianTaiwaneseThaiTlingit-HaidaTohono O'OdhamTonganTrinidadian and TobagonianTsimshianTurkishU.S. Virgin IslanderUgandanUkrainianUruguayanUteVenezuelanVietnameseWelshWest IndianYakamaYaquiYugoslavianYumanYup'ikZimbabwean
Immigration
NonimmigrantsImmigrantsAfghanistanAfricaAlbaniaArgentinaArmeniaAsiaAustraliaAustriaBahamasBangladeshBarbadosBelarusBelgiumBelizeBoliviaBosnia and HerzegovinaBrazilBulgariaBurma/MyanmarCabo VerdeCambodiaCameroonCanadaCaribbeanCentral AmericaChileChinaColombiaCongoCosta RicaCroatiaCubaCzechoslovakiaDenmarkDominicaDominican RepublicEastern AfricaEastern AsiaEastern EuropeEcuadorEgyptEl SalvadorEnglandEritreaEthiopiaEuropeFijiFranceGermanyGhanaGreeceGrenadaGuatemalaGuyanaHaitiHondurasHong KongHungaryIndiaIndonesiaIranIraqIrelandIsraelItalyJamaicaJapanJordanKazakhstanKenyaKoreaKuwaitLaosLatin AmericaLatviaLebanonLiberiaLithuaniaMalaysiaMexicoMicronesiaMiddle AfricaMoldovaMoroccoNepalNetherlandsNicaraguaNigeriaNorth AmericaNorth MacedoniaNorthern AfricaNorthern EuropeNorwayOceaniaPakistanPanamaPeruPhilippinesPolandPortugalRomaniaRussiaSaudi ArabiaScotlandSenegalSerbiaSierra LeoneSingaporeSomaliaSouth AmericaSouth Central AsiaSouth Eastern AsiaSouthern EuropeSpainSri LankaSt. Vincent and the GrenadinesSudanSwedenSwitzerlandSyriaTaiwanThailandTrinidad and TobagoTurkeyUgandaUkraineUruguayUzbekistanVenezuelaVietnamWest IndiesWestern AfricaWestern AsiaWestern EuropeYemenZaireZimbabweAzores
Immigrants from South Africa
Race
Ancestry
AfghanAfricanAlaska NativeAlaskan AthabascanAlbanianAleutAlsatianAmericanApacheArabArapahoArgentineanArmenianAssyrian/Chaldean/SyriacAustralianAustrianBahamianBangladeshiBarbadianBasqueBelgianBelizeanBermudanBhutaneseBlackfeetBolivianBrazilianBritishBritish West IndianBulgarianBurmeseCajunCambodianCanadianCape VerdeanCarpatho RusynCelticCentral AmericanCentral American IndianCherokeeCheyenneChickasawChileanChineseChippewaChoctawColombianColvilleComancheCosta RicanCreeCreekCroatianCrowCubanCypriotCzechCzechoslovakianDanishDelawareDominicanDutchDutch West IndianEastern EuropeanEcuadorianEgyptianEnglishEstonianEthiopianEuropeanFijianFilipinoFinnishFrenchFrench American IndianFrench CanadianGermanGerman RussianGhanaianGreekGuamanian/ChamorroGuatemalanGuyaneseHaitianHmongHonduranHopiHoumaHungarianIcelanderIndian (Asian)IndonesianInupiatIranianIraqiIrishIroquoisIsraeliItalianJamaicanJapaneseJordanianKenyanKiowaKoreanLaotianLatvianLebaneseLiberianLithuanianLumbeeLuxembourgerMacedonianMalaysianMalteseMarshalleseMenomineeMexicanMexican American IndianMongolianMoroccanNative HawaiianNavajoNepaleseNew ZealanderNicaraguanNigerianNorthern EuropeanNorwegianOkinawanOsageOttawaPaiutePakistaniPalestinianPanamanianParaguayanPennsylvania GermanPeruvianPimaPolishPortuguesePotawatomiPuebloPuerto RicanPuget Sound SalishRomanianRussianSalvadoranSamoanScandinavianScotch-IrishScottishSenegaleseSerbianShoshoneSierra LeoneanSiouxSlavicSlovakSloveneSomaliSouth AfricanSouth AmericanSouth American IndianSoviet UnionSpaniardSpanishSpanish AmericanSpanish American IndianSri LankanSubsaharan AfricanSudaneseSwedishSwissSyrianTaiwaneseThaiTlingit-HaidaTohono O'OdhamTonganTrinidadian and TobagonianTsimshianTurkishU.S. Virgin IslanderUgandanUkrainianUruguayanUteVenezuelanVietnameseWelshWest IndianYakamaYaquiYugoslavianYumanYup'ikZimbabwean
Immigration
NonimmigrantsImmigrantsAfghanistanAfricaAlbaniaArgentinaArmeniaAsiaAustraliaAustriaBahamasBangladeshBarbadosBelarusBelgiumBelizeBoliviaBosnia and HerzegovinaBrazilBulgariaBurma/MyanmarCabo VerdeCambodiaCameroonCanadaCaribbeanCentral AmericaChileChinaColombiaCongoCosta RicaCroatiaCubaCzechoslovakiaDenmarkDominicaDominican RepublicEastern AfricaEastern AsiaEastern EuropeEcuadorEgyptEl SalvadorEnglandEritreaEthiopiaEuropeFijiFranceGermanyGhanaGreeceGrenadaGuatemalaGuyanaHaitiHondurasHong KongHungaryIndiaIndonesiaIranIraqIrelandIsraelItalyJamaicaJapanJordanKazakhstanKenyaKoreaKuwaitLaosLatin AmericaLatviaLebanonLiberiaLithuaniaMalaysiaMexicoMicronesiaMiddle AfricaMoldovaMoroccoNepalNetherlandsNicaraguaNigeriaNorth AmericaNorth MacedoniaNorthern AfricaNorthern EuropeNorwayOceaniaPakistanPanamaPeruPhilippinesPolandPortugalRomaniaRussiaSaudi ArabiaScotlandSenegalSerbiaSierra LeoneSingaporeSomaliaSouth AfricaSouth AmericaSouth Central AsiaSouth Eastern AsiaSouthern EuropeSpainSri LankaSt. Vincent and the GrenadinesSudanSwedenSwitzerlandSyriaTaiwanThailandTrinidad and TobagoTurkeyUgandaUkraineUruguayUzbekistanVenezuelaVietnamWest IndiesWestern AfricaWestern AsiaWestern EuropeYemenZaireZimbabweAzores
Unemployment Among Women with Children Under 6 years
Income
Poverty
Unemployment
Labor Participation
Family Structure
Vehicle Availability
Education Level
Disability

Unemployment Among Women with Children Under 6 years Comparison

Seminole

Immigrants from South Africa

Tragic
Exceptional
8.7%
UNEMPLOYMENT AMONG WOMEN WITH CHILDREN UNDER 6 YEARS
0.0/ 100
METRIC RATING
286th/ 347
METRIC RANK
7.3%
UNEMPLOYMENT AMONG WOMEN WITH CHILDREN UNDER 6 YEARS
92.5/ 100
METRIC RATING
124th/ 347
METRIC RANK

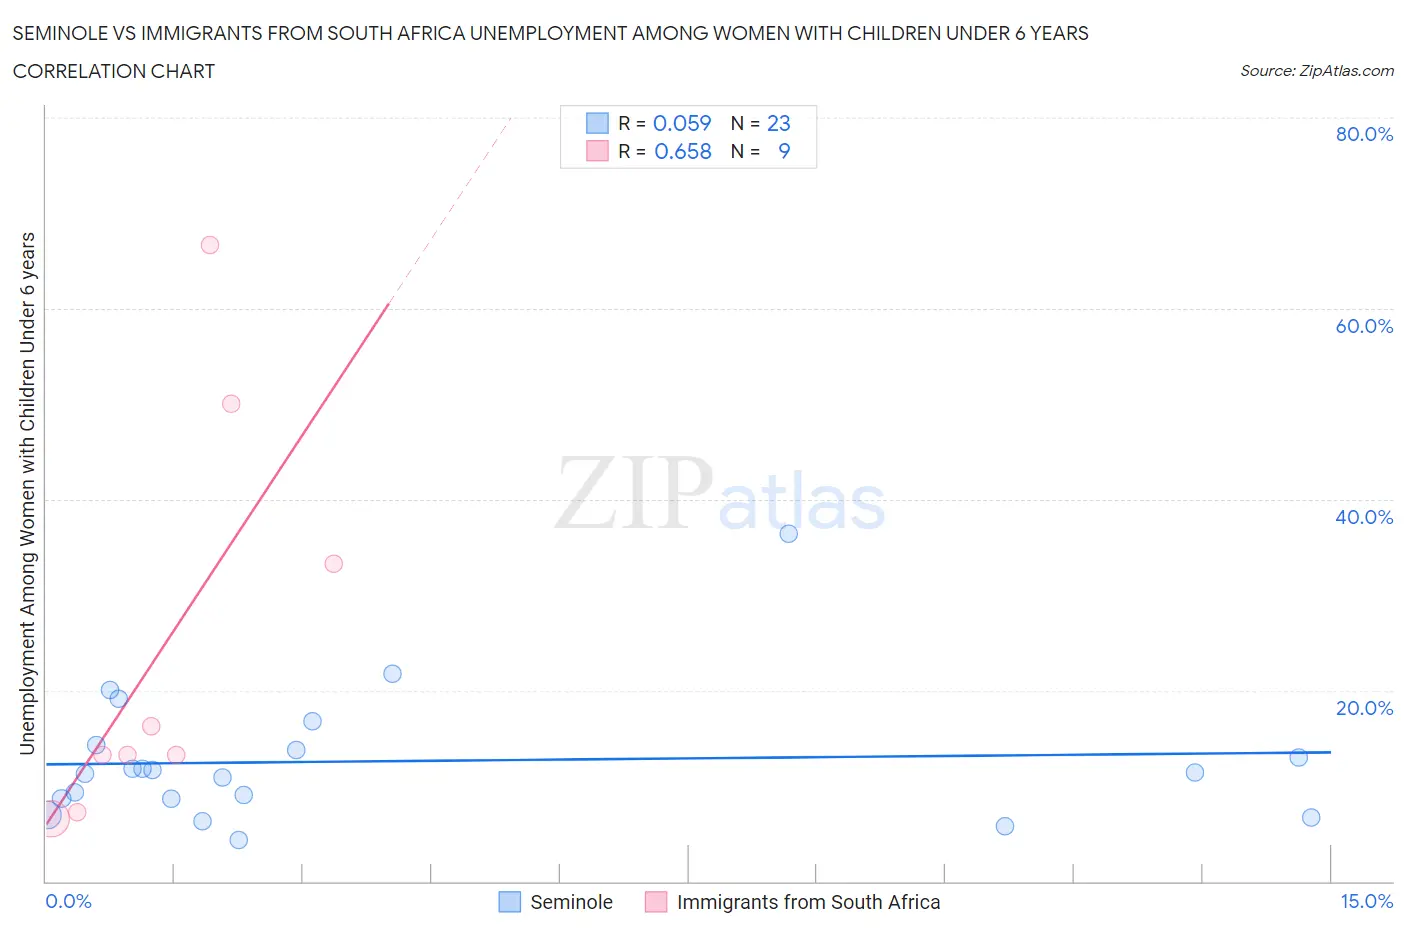
Seminole vs Immigrants from South Africa Unemployment Among Women with Children Under 6 years Correlation Chart

The statistical analysis conducted on geographies consisting of 105,546,612 people shows a slight positive correlation between the proportion of Seminole and unemployment rate among women with children under the age of 6 in the United States with a correlation coefficient (R) of 0.059 and weighted average of 8.7%. Similarly, the statistical analysis conducted on geographies consisting of 190,041,875 people shows a significant positive correlation between the proportion of Immigrants from South Africa and unemployment rate among women with children under the age of 6 in the United States with a correlation coefficient (R) of 0.658 and weighted average of 7.3%, a difference of 18.8%.
Seminole vs Immigrants from South Africa Unemployment Among Women with Children Under 6 years

Unemployment Among Women with Children Under 6 years Correlation Summary

MeasurementSeminoleImmigrants from South Africa
Minimum4.3%6.6%
Maximum36.4%66.7%
Range32.1%60.1%
Mean12.6%24.4%
Median11.4%13.3%
Interquartile 25% (IQ1)8.6%10.3%
Interquartile 75% (IQ3)14.2%41.6%
Interquartile Range (IQR)5.6%31.4%
Standard Deviation (Sample)6.9%21.1%
Standard Deviation (Population)6.8%19.9%

Similar Demographics by Unemployment Among Women with Children Under 6 years

Demographics Similar to Seminole by Unemployment Among Women with Children Under 6 years

In terms of unemployment among women with children under 6 years, the demographic groups most similar to Seminole are U.S. Virgin Islander (8.7%, a difference of 0.0%), Menominee (8.7%, a difference of 0.15%), Blackfeet (8.7%, a difference of 0.20%), Bahamian (8.7%, a difference of 0.35%), and Spanish American Indian (8.7%, a difference of 0.36%).
DemographicsRating | RankUnemployment Among Women with Children Under 6 years
Immigrants | Guatemala
0.0
/100
|
#279
Tragic
8.6%
Immigrants | Belize
0.0
/100
|
#280
Tragic
8.6%
Guatemalans
0.0
/100
|
#281
Tragic
8.7%
Bermudans
0.0
/100
|
#282
Tragic
8.7%
Spanish American Indians
0.0
/100
|
#283
Tragic
8.7%
Blackfeet
0.0
/100
|
#284
Tragic
8.7%
U.S. Virgin Islanders
0.0
/100
|
#285
Tragic
8.7%
Seminole
0.0
/100
|
#286
Tragic
8.7%
Menominee
0.0
/100
|
#287
Tragic
8.7%
Bahamians
0.0
/100
|
#288
Tragic
8.7%
Iroquois
0.0
/100
|
#289
Tragic
8.7%
Vietnamese
0.0
/100
|
#290
Tragic
8.8%
Jamaicans
0.0
/100
|
#291
Tragic
8.8%
Cheyenne
0.0
/100
|
#292
Tragic
8.8%
Immigrants | Bangladesh
0.0
/100
|
#293
Tragic
8.8%

Demographics Similar to Immigrants from South Africa by Unemployment Among Women with Children Under 6 years

In terms of unemployment among women with children under 6 years, the demographic groups most similar to Immigrants from South Africa are Pakistani (7.3%, a difference of 0.080%), Immigrants from Burma/Myanmar (7.3%, a difference of 0.15%), Immigrants from Zaire (7.3%, a difference of 0.20%), Immigrants from Bosnia and Herzegovina (7.3%, a difference of 0.25%), and Jordanian (7.3%, a difference of 0.25%).
DemographicsRating | RankUnemployment Among Women with Children Under 6 years
Immigrants | Kenya
95.4
/100
|
#117
Exceptional
7.3%
Serbians
94.5
/100
|
#118
Exceptional
7.3%
South Africans
94.1
/100
|
#119
Exceptional
7.3%
Iraqis
93.9
/100
|
#120
Exceptional
7.3%
Immigrants | Chile
93.5
/100
|
#121
Exceptional
7.3%
Immigrants | Bosnia and Herzegovina
93.5
/100
|
#122
Exceptional
7.3%
Immigrants | Zaire
93.3
/100
|
#123
Exceptional
7.3%
Immigrants | South Africa
92.5
/100
|
#124
Exceptional
7.3%
Pakistanis
92.2
/100
|
#125
Exceptional
7.3%
Immigrants | Burma/Myanmar
91.9
/100
|
#126
Exceptional
7.3%
Jordanians
91.5
/100
|
#127
Exceptional
7.3%
Zimbabweans
91.5
/100
|
#128
Exceptional
7.3%
Slovenes
89.2
/100
|
#129
Excellent
7.4%
Swedes
88.4
/100
|
#130
Excellent
7.4%
Ukrainians
88.2
/100
|
#131
Excellent
7.4%