Sioux vs Immigrants from South Africa Unemployment Among Women with Children Under 6 years
COMPARE
Sioux
Immigrants from South Africa
Unemployment Among Women with Children Under 6 years
Unemployment Among Women with Children Under 6 years Comparison
Sioux
Immigrants from South Africa
11.5%
UNEMPLOYMENT AMONG WOMEN WITH CHILDREN UNDER 6 YEARS
0.0/ 100
METRIC RATING
332nd/ 347
METRIC RANK
7.3%
UNEMPLOYMENT AMONG WOMEN WITH CHILDREN UNDER 6 YEARS
92.5/ 100
METRIC RATING
124th/ 347
METRIC RANK
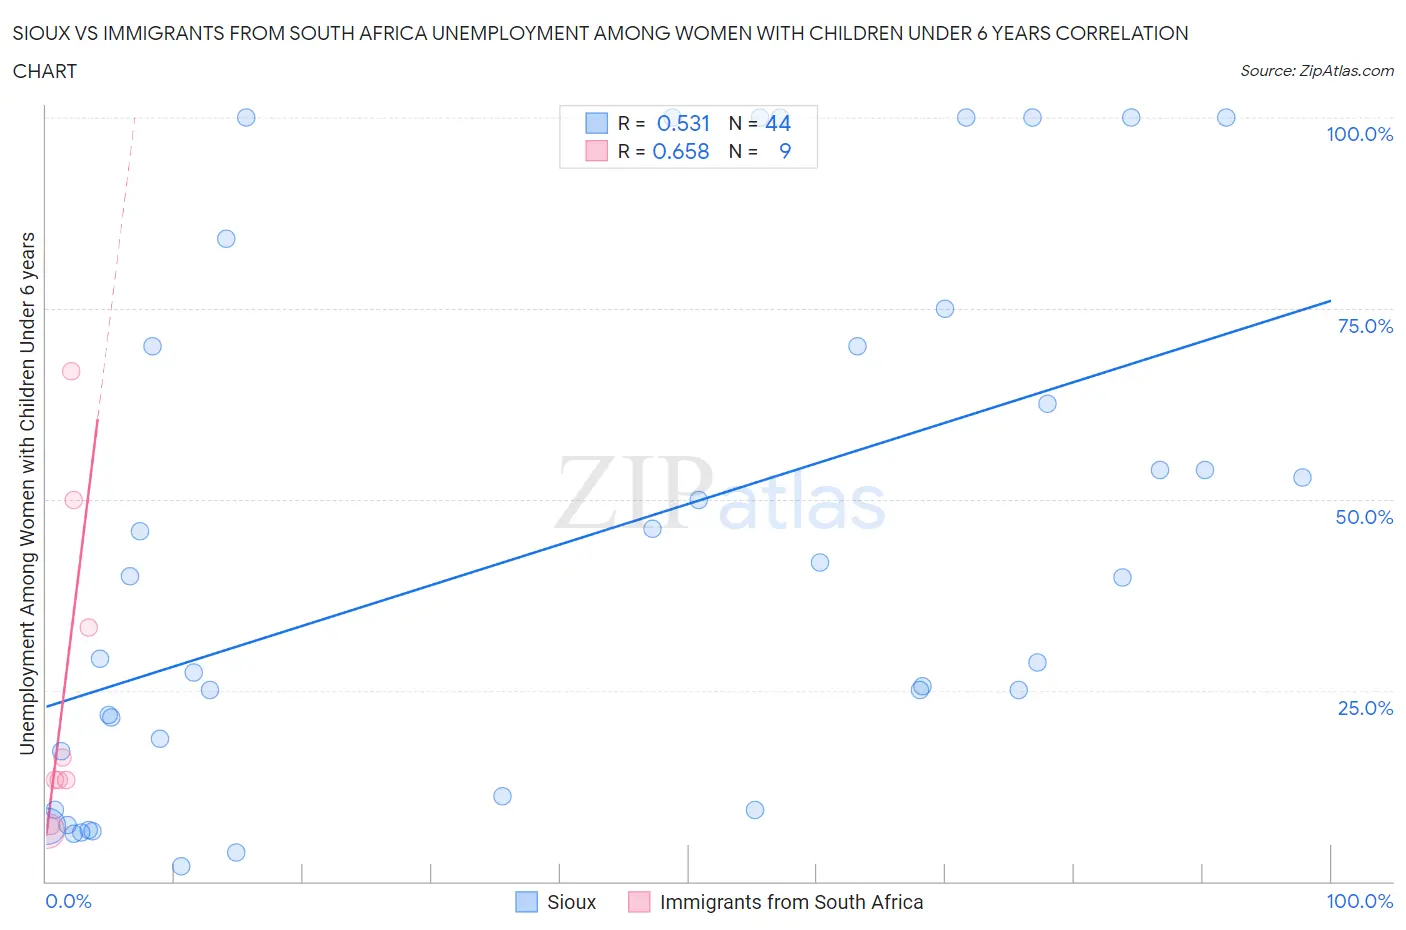
Sioux vs Immigrants from South Africa Unemployment Among Women with Children Under 6 years Correlation Chart
The statistical analysis conducted on geographies consisting of 190,203,570 people shows a substantial positive correlation between the proportion of Sioux and unemployment rate among women with children under the age of 6 in the United States with a correlation coefficient (R) of 0.531 and weighted average of 11.5%. Similarly, the statistical analysis conducted on geographies consisting of 190,041,875 people shows a significant positive correlation between the proportion of Immigrants from South Africa and unemployment rate among women with children under the age of 6 in the United States with a correlation coefficient (R) of 0.658 and weighted average of 7.3%, a difference of 56.4%.
Unemployment Among Women with Children Under 6 years Correlation Summary
| Measurement | Sioux | Immigrants from South Africa |
| Minimum | 2.0% | 6.6% |
| Maximum | 100.0% | 66.7% |
| Range | 98.0% | 60.1% |
| Mean | 43.8% | 24.4% |
| Median | 34.5% | 13.3% |
| Interquartile 25% (IQ1) | 14.1% | 10.3% |
| Interquartile 75% (IQ3) | 70.0% | 41.6% |
| Interquartile Range (IQR) | 55.9% | 31.4% |
| Standard Deviation (Sample) | 33.9% | 21.1% |
| Standard Deviation (Population) | 33.5% | 19.9% |
Similar Demographics by Unemployment Among Women with Children Under 6 years
Demographics Similar to Sioux by Unemployment Among Women with Children Under 6 years
In terms of unemployment among women with children under 6 years, the demographic groups most similar to Sioux are Native/Alaskan (11.5%, a difference of 0.56%), Colville (11.2%, a difference of 2.7%), Pennsylvania German (10.8%, a difference of 6.4%), Apache (12.3%, a difference of 7.5%), and Puerto Rican (12.5%, a difference of 9.5%).
| Demographics | Rating | Rank | Unemployment Among Women with Children Under 6 years |
| Choctaw | 0.0 /100 | #325 | Tragic 9.8% |
| Delaware | 0.0 /100 | #326 | Tragic 9.8% |
| Ottawa | 0.0 /100 | #327 | Tragic 9.9% |
| Tohono O'odham | 0.0 /100 | #328 | Tragic 10.2% |
| Blacks/African Americans | 0.0 /100 | #329 | Tragic 10.3% |
| Pennsylvania Germans | 0.0 /100 | #330 | Tragic 10.8% |
| Colville | 0.0 /100 | #331 | Tragic 11.2% |
| Sioux | 0.0 /100 | #332 | Tragic 11.5% |
| Natives/Alaskans | 0.0 /100 | #333 | Tragic 11.5% |
| Apache | 0.0 /100 | #334 | Tragic 12.3% |
| Puerto Ricans | 0.0 /100 | #335 | Tragic 12.5% |
| Shoshone | 0.0 /100 | #336 | Tragic 13.2% |
| Chippewa | 0.0 /100 | #337 | Tragic 13.3% |
| Pima | 0.0 /100 | #338 | Tragic 13.4% |
| Navajo | 0.0 /100 | #339 | Tragic 13.5% |
Demographics Similar to Immigrants from South Africa by Unemployment Among Women with Children Under 6 years
In terms of unemployment among women with children under 6 years, the demographic groups most similar to Immigrants from South Africa are Pakistani (7.3%, a difference of 0.080%), Immigrants from Burma/Myanmar (7.3%, a difference of 0.15%), Immigrants from Zaire (7.3%, a difference of 0.20%), Immigrants from Bosnia and Herzegovina (7.3%, a difference of 0.25%), and Jordanian (7.3%, a difference of 0.25%).
| Demographics | Rating | Rank | Unemployment Among Women with Children Under 6 years |
| Immigrants | Kenya | 95.4 /100 | #117 | Exceptional 7.3% |
| Serbians | 94.5 /100 | #118 | Exceptional 7.3% |
| South Africans | 94.1 /100 | #119 | Exceptional 7.3% |
| Iraqis | 93.9 /100 | #120 | Exceptional 7.3% |
| Immigrants | Chile | 93.5 /100 | #121 | Exceptional 7.3% |
| Immigrants | Bosnia and Herzegovina | 93.5 /100 | #122 | Exceptional 7.3% |
| Immigrants | Zaire | 93.3 /100 | #123 | Exceptional 7.3% |
| Immigrants | South Africa | 92.5 /100 | #124 | Exceptional 7.3% |
| Pakistanis | 92.2 /100 | #125 | Exceptional 7.3% |
| Immigrants | Burma/Myanmar | 91.9 /100 | #126 | Exceptional 7.3% |
| Jordanians | 91.5 /100 | #127 | Exceptional 7.3% |
| Zimbabweans | 91.5 /100 | #128 | Exceptional 7.3% |
| Slovenes | 89.2 /100 | #129 | Excellent 7.4% |
| Swedes | 88.4 /100 | #130 | Excellent 7.4% |
| Ukrainians | 88.2 /100 | #131 | Excellent 7.4% |