Immigrants from Grenada vs Immigrants from South Africa Unemployment Among Women with Children Under 6 years
COMPARE
Immigrants from Grenada
Immigrants from South Africa
Unemployment Among Women with Children Under 6 years
Unemployment Among Women with Children Under 6 years Comparison
Immigrants from Grenada
Immigrants from South Africa
7.6%
UNEMPLOYMENT AMONG WOMEN WITH CHILDREN UNDER 6 YEARS
59.0/ 100
METRIC RATING
171st/ 347
METRIC RANK
7.3%
UNEMPLOYMENT AMONG WOMEN WITH CHILDREN UNDER 6 YEARS
92.5/ 100
METRIC RATING
124th/ 347
METRIC RANK
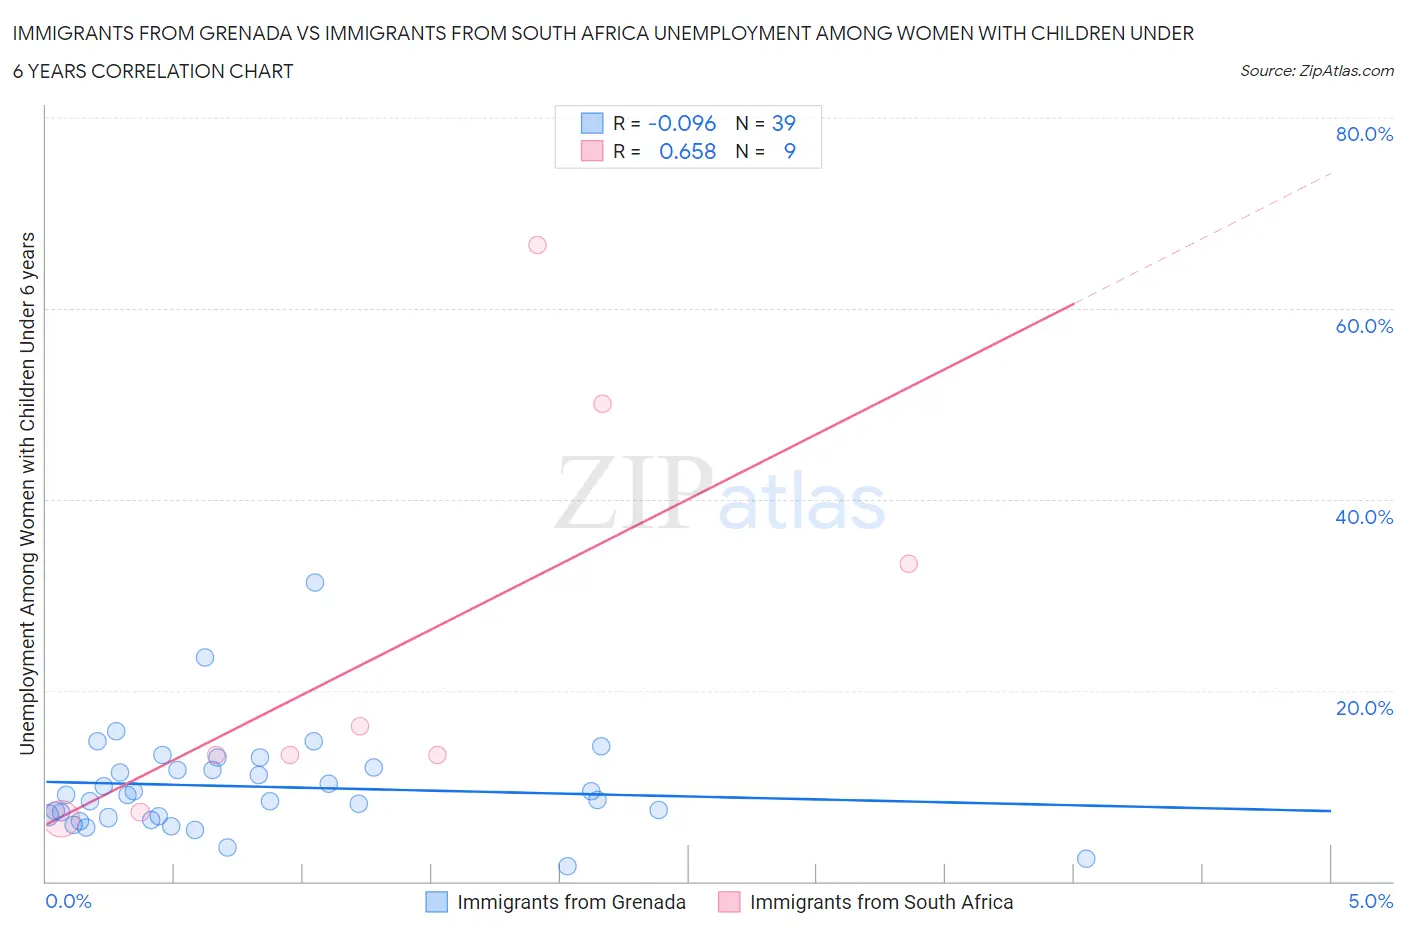
Immigrants from Grenada vs Immigrants from South Africa Unemployment Among Women with Children Under 6 years Correlation Chart
The statistical analysis conducted on geographies consisting of 61,595,410 people shows a slight negative correlation between the proportion of Immigrants from Grenada and unemployment rate among women with children under the age of 6 in the United States with a correlation coefficient (R) of -0.096 and weighted average of 7.6%. Similarly, the statistical analysis conducted on geographies consisting of 190,041,875 people shows a significant positive correlation between the proportion of Immigrants from South Africa and unemployment rate among women with children under the age of 6 in the United States with a correlation coefficient (R) of 0.658 and weighted average of 7.3%, a difference of 3.7%.
Unemployment Among Women with Children Under 6 years Correlation Summary
| Measurement | Immigrants from Grenada | Immigrants from South Africa |
| Minimum | 1.6% | 6.6% |
| Maximum | 31.3% | 66.7% |
| Range | 29.7% | 60.1% |
| Mean | 9.9% | 24.4% |
| Median | 9.0% | 13.3% |
| Interquartile 25% (IQ1) | 6.7% | 10.3% |
| Interquartile 75% (IQ3) | 11.9% | 41.6% |
| Interquartile Range (IQR) | 5.2% | 31.4% |
| Standard Deviation (Sample) | 5.4% | 21.1% |
| Standard Deviation (Population) | 5.3% | 19.9% |
Similar Demographics by Unemployment Among Women with Children Under 6 years
Demographics Similar to Immigrants from Grenada by Unemployment Among Women with Children Under 6 years
In terms of unemployment among women with children under 6 years, the demographic groups most similar to Immigrants from Grenada are Czech (7.6%, a difference of 0.060%), Immigrants from North America (7.6%, a difference of 0.090%), Immigrants from Scotland (7.6%, a difference of 0.16%), Immigrants from Canada (7.6%, a difference of 0.18%), and Kenyan (7.6%, a difference of 0.25%).
| Demographics | Rating | Rank | Unemployment Among Women with Children Under 6 years |
| Ugandans | 65.8 /100 | #164 | Good 7.6% |
| Immigrants | South America | 65.6 /100 | #165 | Good 7.6% |
| Belgians | 63.5 /100 | #166 | Good 7.6% |
| Kenyans | 62.5 /100 | #167 | Good 7.6% |
| Immigrants | Canada | 61.6 /100 | #168 | Good 7.6% |
| Immigrants | Scotland | 61.3 /100 | #169 | Good 7.6% |
| Czechs | 59.8 /100 | #170 | Average 7.6% |
| Immigrants | Grenada | 59.0 /100 | #171 | Average 7.6% |
| Immigrants | North America | 57.7 /100 | #172 | Average 7.6% |
| Cree | 51.6 /100 | #173 | Average 7.6% |
| Immigrants | Laos | 50.0 /100 | #174 | Average 7.6% |
| Panamanians | 49.6 /100 | #175 | Average 7.6% |
| Puget Sound Salish | 47.7 /100 | #176 | Average 7.7% |
| Austrians | 46.0 /100 | #177 | Average 7.7% |
| Immigrants | England | 45.4 /100 | #178 | Average 7.7% |
Demographics Similar to Immigrants from South Africa by Unemployment Among Women with Children Under 6 years
In terms of unemployment among women with children under 6 years, the demographic groups most similar to Immigrants from South Africa are Pakistani (7.3%, a difference of 0.080%), Immigrants from Burma/Myanmar (7.3%, a difference of 0.15%), Immigrants from Zaire (7.3%, a difference of 0.20%), Immigrants from Bosnia and Herzegovina (7.3%, a difference of 0.25%), and Jordanian (7.3%, a difference of 0.25%).
| Demographics | Rating | Rank | Unemployment Among Women with Children Under 6 years |
| Immigrants | Kenya | 95.4 /100 | #117 | Exceptional 7.3% |
| Serbians | 94.5 /100 | #118 | Exceptional 7.3% |
| South Africans | 94.1 /100 | #119 | Exceptional 7.3% |
| Iraqis | 93.9 /100 | #120 | Exceptional 7.3% |
| Immigrants | Chile | 93.5 /100 | #121 | Exceptional 7.3% |
| Immigrants | Bosnia and Herzegovina | 93.5 /100 | #122 | Exceptional 7.3% |
| Immigrants | Zaire | 93.3 /100 | #123 | Exceptional 7.3% |
| Immigrants | South Africa | 92.5 /100 | #124 | Exceptional 7.3% |
| Pakistanis | 92.2 /100 | #125 | Exceptional 7.3% |
| Immigrants | Burma/Myanmar | 91.9 /100 | #126 | Exceptional 7.3% |
| Jordanians | 91.5 /100 | #127 | Exceptional 7.3% |
| Zimbabweans | 91.5 /100 | #128 | Exceptional 7.3% |
| Slovenes | 89.2 /100 | #129 | Excellent 7.4% |
| Swedes | 88.4 /100 | #130 | Excellent 7.4% |
| Ukrainians | 88.2 /100 | #131 | Excellent 7.4% |