Seminole vs Immigrants from Liberia Unemployment Among Ages 65 to 74 years
COMPARE
Seminole
Immigrants from Liberia
Unemployment Among Ages 65 to 74 years
Unemployment Among Ages 65 to 74 years Comparison
Seminole
Immigrants from Liberia
5.4%
UNEMPLOYMENT AMONG AGES 65 TO 74 YEARS
14.3/ 100
METRIC RATING
204th/ 347
METRIC RANK
5.7%
UNEMPLOYMENT AMONG AGES 65 TO 74 YEARS
0.1/ 100
METRIC RATING
275th/ 347
METRIC RANK
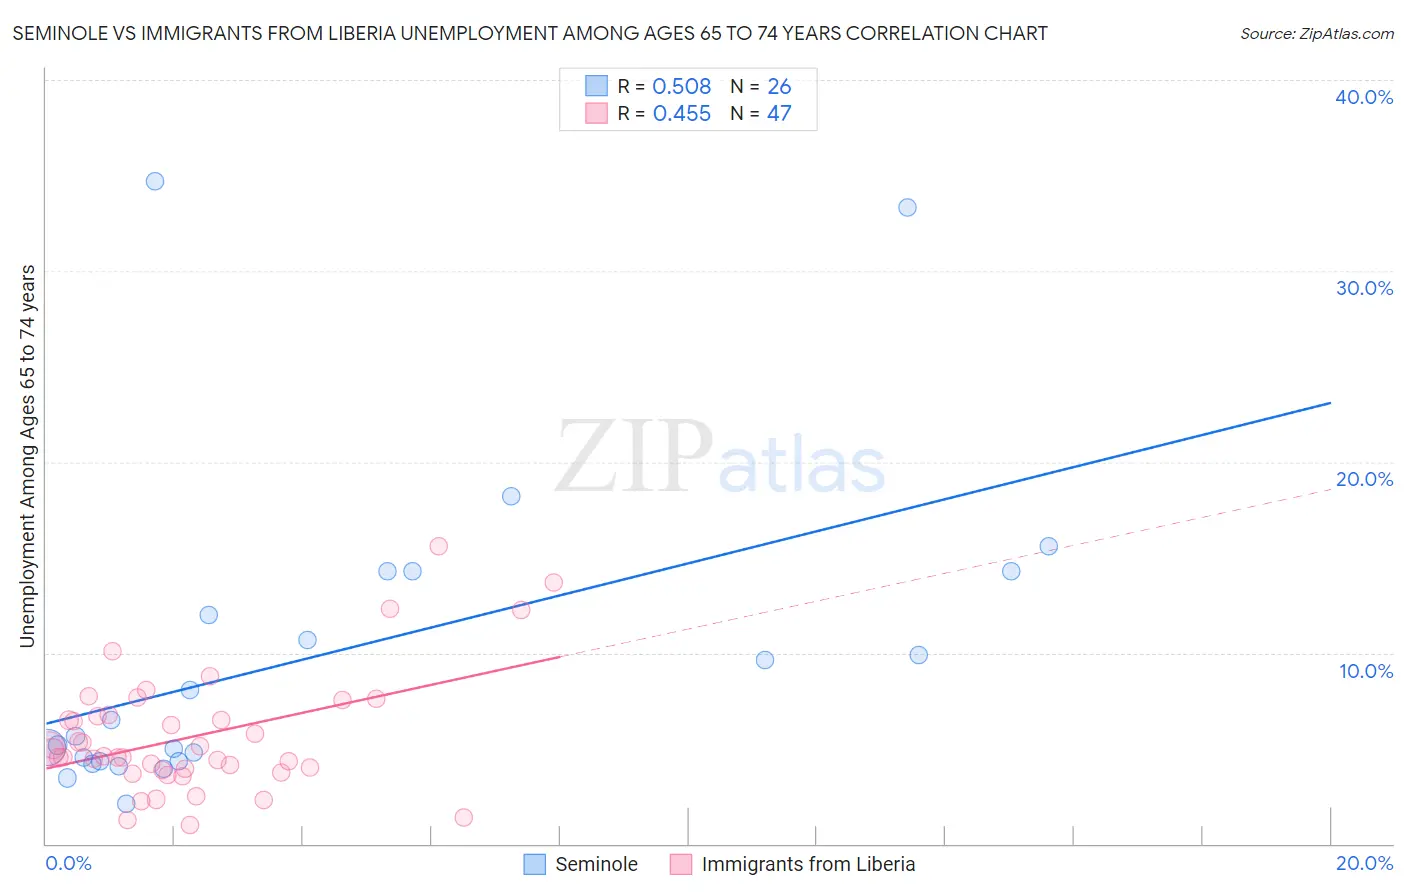
Seminole vs Immigrants from Liberia Unemployment Among Ages 65 to 74 years Correlation Chart
The statistical analysis conducted on geographies consisting of 111,050,391 people shows a substantial positive correlation between the proportion of Seminole and unemployment rate among population between the ages 65 and 74 in the United States with a correlation coefficient (R) of 0.508 and weighted average of 5.4%. Similarly, the statistical analysis conducted on geographies consisting of 128,529,481 people shows a moderate positive correlation between the proportion of Immigrants from Liberia and unemployment rate among population between the ages 65 and 74 in the United States with a correlation coefficient (R) of 0.455 and weighted average of 5.7%, a difference of 4.0%.
Unemployment Among Ages 65 to 74 years Correlation Summary
| Measurement | Seminole | Immigrants from Liberia |
| Minimum | 2.1% | 1.0% |
| Maximum | 34.7% | 15.6% |
| Range | 32.6% | 14.6% |
| Mean | 9.9% | 5.6% |
| Median | 6.0% | 4.6% |
| Interquartile 25% (IQ1) | 4.4% | 3.8% |
| Interquartile 75% (IQ3) | 14.3% | 6.8% |
| Interquartile Range (IQR) | 9.9% | 2.9% |
| Standard Deviation (Sample) | 8.4% | 3.1% |
| Standard Deviation (Population) | 8.2% | 3.1% |
Similar Demographics by Unemployment Among Ages 65 to 74 years
Demographics Similar to Seminole by Unemployment Among Ages 65 to 74 years
In terms of unemployment among ages 65 to 74 years, the demographic groups most similar to Seminole are Subsaharan African (5.4%, a difference of 0.0%), Argentinean (5.4%, a difference of 0.0%), Icelander (5.4%, a difference of 0.010%), Immigrants from Western Asia (5.4%, a difference of 0.040%), and Immigrants from Pakistan (5.4%, a difference of 0.060%).
| Demographics | Rating | Rank | Unemployment Among Ages 65 to 74 years |
| Colville | 20.4 /100 | #197 | Fair 5.4% |
| Albanians | 17.8 /100 | #198 | Poor 5.4% |
| Immigrants | Belgium | 16.2 /100 | #199 | Poor 5.4% |
| Immigrants | Pakistan | 15.2 /100 | #200 | Poor 5.4% |
| Immigrants | Western Asia | 14.9 /100 | #201 | Poor 5.4% |
| Sub-Saharan Africans | 14.4 /100 | #202 | Poor 5.4% |
| Argentineans | 14.3 /100 | #203 | Poor 5.4% |
| Seminole | 14.3 /100 | #204 | Poor 5.4% |
| Icelanders | 14.2 /100 | #205 | Poor 5.4% |
| Africans | 12.8 /100 | #206 | Poor 5.5% |
| Immigrants | Uzbekistan | 12.5 /100 | #207 | Poor 5.5% |
| Dutch West Indians | 11.5 /100 | #208 | Poor 5.5% |
| Immigrants | Honduras | 10.4 /100 | #209 | Poor 5.5% |
| Immigrants | Northern Africa | 10.1 /100 | #210 | Poor 5.5% |
| Immigrants | Croatia | 9.1 /100 | #211 | Tragic 5.5% |
Demographics Similar to Immigrants from Liberia by Unemployment Among Ages 65 to 74 years
In terms of unemployment among ages 65 to 74 years, the demographic groups most similar to Immigrants from Liberia are Immigrants from Guyana (5.7%, a difference of 0.040%), Somali (5.7%, a difference of 0.050%), Bahamian (5.7%, a difference of 0.060%), Yaqui (5.7%, a difference of 0.080%), and Belizean (5.7%, a difference of 0.10%).
| Demographics | Rating | Rank | Unemployment Among Ages 65 to 74 years |
| Hawaiians | 0.2 /100 | #268 | Tragic 5.7% |
| Immigrants | Colombia | 0.1 /100 | #269 | Tragic 5.7% |
| Immigrants | Nigeria | 0.1 /100 | #270 | Tragic 5.7% |
| Belizeans | 0.1 /100 | #271 | Tragic 5.7% |
| Yaqui | 0.1 /100 | #272 | Tragic 5.7% |
| Bahamians | 0.1 /100 | #273 | Tragic 5.7% |
| Immigrants | Guyana | 0.1 /100 | #274 | Tragic 5.7% |
| Immigrants | Liberia | 0.1 /100 | #275 | Tragic 5.7% |
| Somalis | 0.1 /100 | #276 | Tragic 5.7% |
| Immigrants | South America | 0.1 /100 | #277 | Tragic 5.7% |
| Mexican American Indians | 0.1 /100 | #278 | Tragic 5.7% |
| Immigrants | Norway | 0.1 /100 | #279 | Tragic 5.7% |
| Moroccans | 0.1 /100 | #280 | Tragic 5.7% |
| Immigrants | West Indies | 0.1 /100 | #281 | Tragic 5.7% |
| Ottawa | 0.1 /100 | #282 | Tragic 5.7% |