Immigrants from Netherlands vs Immigrants from Panama Unemployment Among Ages 55 to 59 years
COMPARE
Immigrants from Netherlands
Immigrants from Panama
Unemployment Among Ages 55 to 59 years
Unemployment Among Ages 55 to 59 years Comparison
Immigrants from Netherlands
Immigrants from Panama
4.7%
UNEMPLOYMENT AMONG AGES 55 TO 59 YEARS
84.5/ 100
METRIC RATING
133rd/ 347
METRIC RANK
4.8%
UNEMPLOYMENT AMONG AGES 55 TO 59 YEARS
66.8/ 100
METRIC RATING
154th/ 347
METRIC RANK
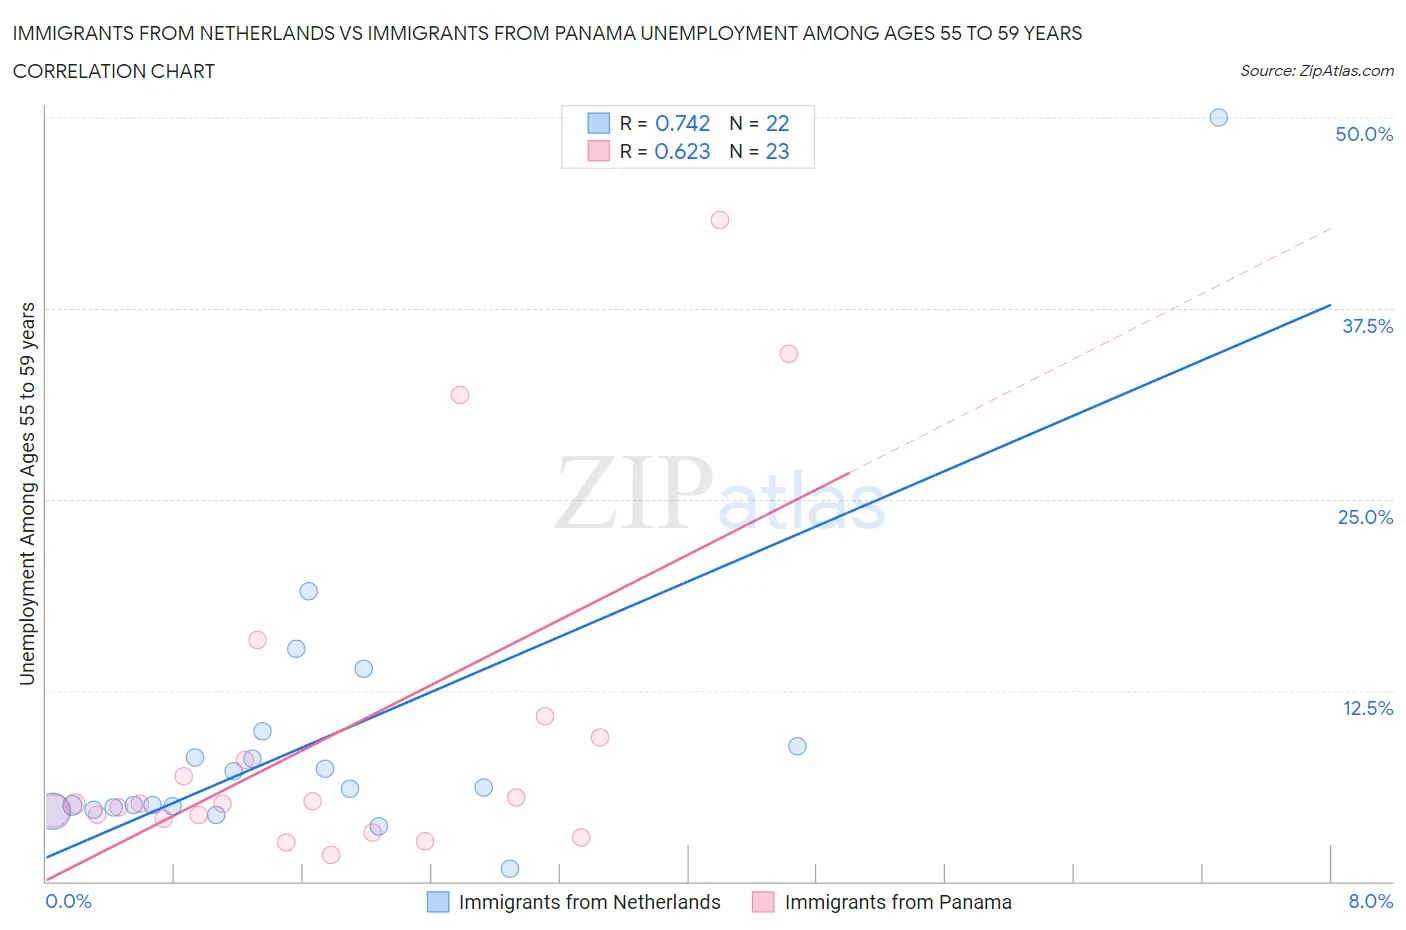
Immigrants from Netherlands vs Immigrants from Panama Unemployment Among Ages 55 to 59 years Correlation Chart
The statistical analysis conducted on geographies consisting of 227,496,970 people shows a strong positive correlation between the proportion of Immigrants from Netherlands and unemployment rate among population between the ages 55 and 59 in the United States with a correlation coefficient (R) of 0.742 and weighted average of 4.7%. Similarly, the statistical analysis conducted on geographies consisting of 213,548,057 people shows a significant positive correlation between the proportion of Immigrants from Panama and unemployment rate among population between the ages 55 and 59 in the United States with a correlation coefficient (R) of 0.623 and weighted average of 4.8%, a difference of 1.0%.
Unemployment Among Ages 55 to 59 years Correlation Summary
| Measurement | Immigrants from Netherlands | Immigrants from Panama |
| Minimum | 0.80% | 1.7% |
| Maximum | 50.0% | 43.3% |
| Range | 49.2% | 41.6% |
| Mean | 9.2% | 9.6% |
| Median | 6.1% | 5.1% |
| Interquartile 25% (IQ1) | 4.8% | 4.1% |
| Interquartile 75% (IQ3) | 8.8% | 9.4% |
| Interquartile Range (IQR) | 4.0% | 5.3% |
| Standard Deviation (Sample) | 10.0% | 11.2% |
| Standard Deviation (Population) | 9.8% | 11.0% |
Similar Demographics by Unemployment Among Ages 55 to 59 years
Demographics Similar to Immigrants from Netherlands by Unemployment Among Ages 55 to 59 years
In terms of unemployment among ages 55 to 59 years, the demographic groups most similar to Immigrants from Netherlands are Panamanian (4.7%, a difference of 0.030%), Immigrants from Romania (4.7%, a difference of 0.060%), Slavic (4.7%, a difference of 0.060%), Immigrants from Thailand (4.7%, a difference of 0.070%), and Colombian (4.7%, a difference of 0.070%).
| Demographics | Rating | Rank | Unemployment Among Ages 55 to 59 years |
| Immigrants | Serbia | 87.8 /100 | #126 | Excellent 4.7% |
| Icelanders | 87.7 /100 | #127 | Excellent 4.7% |
| Pennsylvania Germans | 87.1 /100 | #128 | Excellent 4.7% |
| Immigrants | Sweden | 86.8 /100 | #129 | Excellent 4.7% |
| Greeks | 86.6 /100 | #130 | Excellent 4.7% |
| Immigrants | Thailand | 85.4 /100 | #131 | Excellent 4.7% |
| Immigrants | Romania | 85.3 /100 | #132 | Excellent 4.7% |
| Immigrants | Netherlands | 84.5 /100 | #133 | Excellent 4.7% |
| Panamanians | 84.1 /100 | #134 | Excellent 4.7% |
| Slavs | 83.7 /100 | #135 | Excellent 4.7% |
| Colombians | 83.6 /100 | #136 | Excellent 4.7% |
| Delaware | 83.6 /100 | #137 | Excellent 4.7% |
| Immigrants | Switzerland | 82.9 /100 | #138 | Excellent 4.7% |
| Romanians | 82.7 /100 | #139 | Excellent 4.7% |
| Immigrants | Indonesia | 80.2 /100 | #140 | Excellent 4.8% |
Demographics Similar to Immigrants from Panama by Unemployment Among Ages 55 to 59 years
In terms of unemployment among ages 55 to 59 years, the demographic groups most similar to Immigrants from Panama are Immigrants from Uruguay (4.8%, a difference of 0.020%), Immigrants from North Macedonia (4.8%, a difference of 0.020%), Italian (4.8%, a difference of 0.030%), Carpatho Rusyn (4.8%, a difference of 0.040%), and Laotian (4.8%, a difference of 0.070%).
| Demographics | Rating | Rank | Unemployment Among Ages 55 to 59 years |
| Immigrants | Singapore | 76.6 /100 | #147 | Good 4.8% |
| Immigrants | Bahamas | 71.8 /100 | #148 | Good 4.8% |
| Immigrants | Lithuania | 70.8 /100 | #149 | Good 4.8% |
| Immigrants | Northern Africa | 69.8 /100 | #150 | Good 4.8% |
| Bahamians | 68.6 /100 | #151 | Good 4.8% |
| Laotians | 68.2 /100 | #152 | Good 4.8% |
| Immigrants | Uruguay | 67.2 /100 | #153 | Good 4.8% |
| Immigrants | Panama | 66.8 /100 | #154 | Good 4.8% |
| Immigrants | North Macedonia | 66.3 /100 | #155 | Good 4.8% |
| Italians | 66.2 /100 | #156 | Good 4.8% |
| Carpatho Rusyns | 66.0 /100 | #157 | Good 4.8% |
| Slovaks | 65.3 /100 | #158 | Good 4.8% |
| Immigrants | Nicaragua | 65.2 /100 | #159 | Good 4.8% |
| Chickasaw | 65.1 /100 | #160 | Good 4.8% |
| Koreans | 64.6 /100 | #161 | Good 4.8% |