Scottish vs Moroccan Unemployment
COMPARE
Scottish
Moroccan
Unemployment
Unemployment Comparison
Scottish
Moroccans
4.7%
UNEMPLOYMENT
99.9/ 100
METRIC RATING
19th/ 347
METRIC RANK
5.5%
UNEMPLOYMENT
3.2/ 100
METRIC RATING
237th/ 347
METRIC RANK
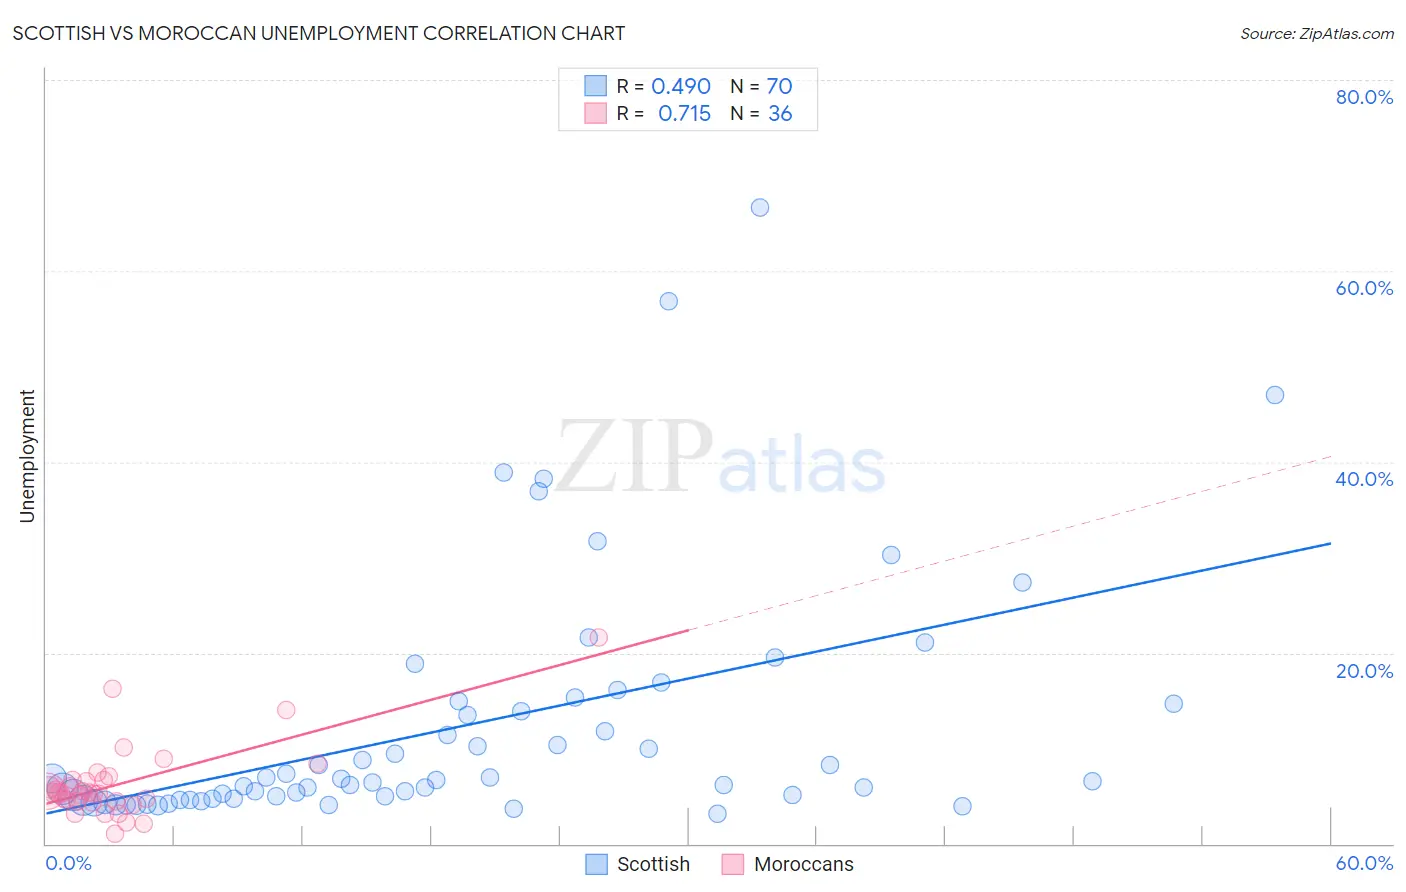
Scottish vs Moroccan Unemployment Correlation Chart
The statistical analysis conducted on geographies consisting of 563,082,415 people shows a moderate positive correlation between the proportion of Scottish and unemployment in the United States with a correlation coefficient (R) of 0.490 and weighted average of 4.7%. Similarly, the statistical analysis conducted on geographies consisting of 201,766,508 people shows a strong positive correlation between the proportion of Moroccans and unemployment in the United States with a correlation coefficient (R) of 0.715 and weighted average of 5.5%, a difference of 18.7%.
Unemployment Correlation Summary
| Measurement | Scottish | Moroccan |
| Minimum | 3.2% | 1.1% |
| Maximum | 66.7% | 21.6% |
| Range | 63.5% | 20.5% |
| Mean | 12.3% | 6.2% |
| Median | 6.6% | 5.3% |
| Interquartile 25% (IQ1) | 4.8% | 4.4% |
| Interquartile 75% (IQ3) | 14.7% | 6.7% |
| Interquartile Range (IQR) | 9.9% | 2.3% |
| Standard Deviation (Sample) | 12.9% | 4.0% |
| Standard Deviation (Population) | 12.8% | 3.9% |
Similar Demographics by Unemployment
Demographics Similar to Scottish by Unemployment
In terms of unemployment, the demographic groups most similar to Scottish are Immigrants from Venezuela (4.7%, a difference of 0.080%), Slovene (4.7%, a difference of 0.10%), Chinese (4.7%, a difference of 0.21%), European (4.6%, a difference of 0.35%), and Carpatho Rusyn (4.7%, a difference of 0.59%).
| Demographics | Rating | Rank | Unemployment |
| Pennsylvania Germans | 100.0 /100 | #12 | Exceptional 4.6% |
| Belgians | 100.0 /100 | #13 | Exceptional 4.6% |
| Immigrants | Cuba | 100.0 /100 | #14 | Exceptional 4.6% |
| Europeans | 99.9 /100 | #15 | Exceptional 4.6% |
| Chinese | 99.9 /100 | #16 | Exceptional 4.7% |
| Slovenes | 99.9 /100 | #17 | Exceptional 4.7% |
| Immigrants | Venezuela | 99.9 /100 | #18 | Exceptional 4.7% |
| Scottish | 99.9 /100 | #19 | Exceptional 4.7% |
| Carpatho Rusyns | 99.9 /100 | #20 | Exceptional 4.7% |
| Welsh | 99.9 /100 | #21 | Exceptional 4.7% |
| Thais | 99.9 /100 | #22 | Exceptional 4.7% |
| British | 99.9 /100 | #23 | Exceptional 4.7% |
| Venezuelans | 99.9 /100 | #24 | Exceptional 4.7% |
| Latvians | 99.9 /100 | #25 | Exceptional 4.7% |
| Bulgarians | 99.9 /100 | #26 | Exceptional 4.7% |
Demographics Similar to Moroccans by Unemployment
In terms of unemployment, the demographic groups most similar to Moroccans are Immigrants from Cambodia (5.5%, a difference of 0.060%), Immigrants from Panama (5.5%, a difference of 0.090%), Immigrants from Western Asia (5.5%, a difference of 0.21%), Immigrants (5.5%, a difference of 0.29%), and Cree (5.6%, a difference of 0.31%).
| Demographics | Rating | Rank | Unemployment |
| Ottawa | 5.4 /100 | #230 | Tragic 5.5% |
| Immigrants | Africa | 4.9 /100 | #231 | Tragic 5.5% |
| Comanche | 4.9 /100 | #232 | Tragic 5.5% |
| Immigrants | Syria | 4.8 /100 | #233 | Tragic 5.5% |
| Panamanians | 4.7 /100 | #234 | Tragic 5.5% |
| Immigrants | Panama | 3.4 /100 | #235 | Tragic 5.5% |
| Immigrants | Cambodia | 3.3 /100 | #236 | Tragic 5.5% |
| Moroccans | 3.2 /100 | #237 | Tragic 5.5% |
| Immigrants | Western Asia | 2.8 /100 | #238 | Tragic 5.5% |
| Immigrants | Immigrants | 2.6 /100 | #239 | Tragic 5.5% |
| Cree | 2.6 /100 | #240 | Tragic 5.6% |
| Tlingit-Haida | 2.0 /100 | #241 | Tragic 5.6% |
| Spanish Americans | 2.0 /100 | #242 | Tragic 5.6% |
| Marshallese | 1.3 /100 | #243 | Tragic 5.6% |
| Dutch West Indians | 1.2 /100 | #244 | Tragic 5.6% |