Tongan vs Tlingit-Haida Unemployment Among Ages 25 to 29 years
COMPARE
Tongan
Tlingit-Haida
Unemployment Among Ages 25 to 29 years
Unemployment Among Ages 25 to 29 years Comparison
Tongans
Tlingit-Haida
5.5%
UNEMPLOYMENT AMONG AGES 25 TO 29 YEARS
100.0/ 100
METRIC RATING
2nd/ 347
METRIC RANK
8.7%
UNEMPLOYMENT AMONG AGES 25 TO 29 YEARS
0.0/ 100
METRIC RATING
322nd/ 347
METRIC RANK
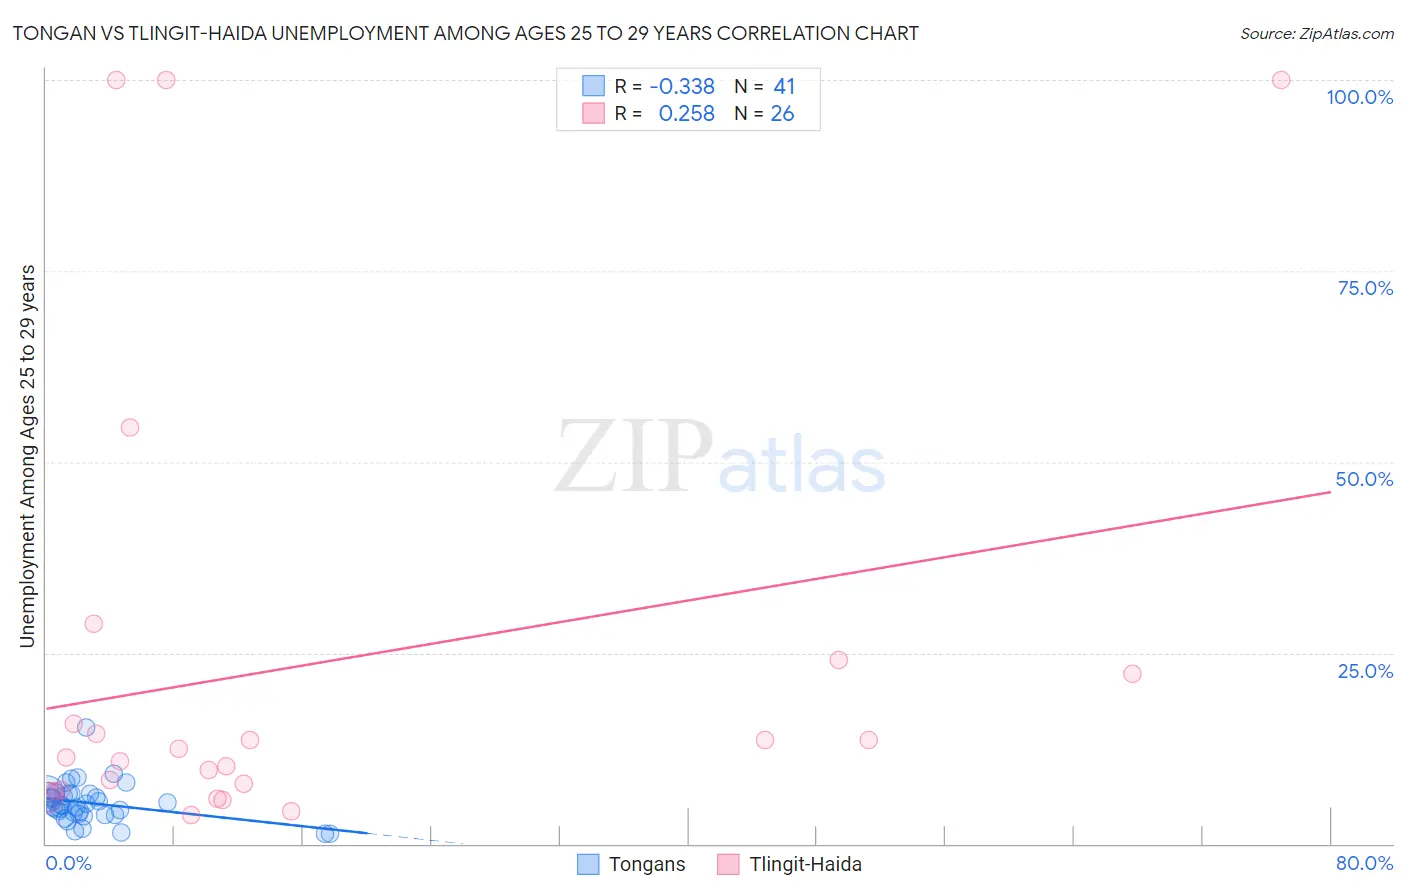
Tongan vs Tlingit-Haida Unemployment Among Ages 25 to 29 years Correlation Chart
The statistical analysis conducted on geographies consisting of 101,173,366 people shows a mild negative correlation between the proportion of Tongans and unemployment rate among population between the ages 25 and 29 in the United States with a correlation coefficient (R) of -0.338 and weighted average of 5.5%. Similarly, the statistical analysis conducted on geographies consisting of 59,716,072 people shows a weak positive correlation between the proportion of Tlingit-Haida and unemployment rate among population between the ages 25 and 29 in the United States with a correlation coefficient (R) of 0.258 and weighted average of 8.7%, a difference of 57.4%.
Unemployment Among Ages 25 to 29 years Correlation Summary
| Measurement | Tongan | Tlingit-Haida |
| Minimum | 1.3% | 3.8% |
| Maximum | 15.2% | 100.0% |
| Range | 13.9% | 96.2% |
| Mean | 5.3% | 23.5% |
| Median | 5.0% | 11.9% |
| Interquartile 25% (IQ1) | 3.8% | 7.0% |
| Interquartile 75% (IQ3) | 6.5% | 22.2% |
| Interquartile Range (IQR) | 2.7% | 15.2% |
| Standard Deviation (Sample) | 2.5% | 30.0% |
| Standard Deviation (Population) | 2.5% | 29.4% |
Similar Demographics by Unemployment Among Ages 25 to 29 years
Demographics Similar to Tongans by Unemployment Among Ages 25 to 29 years
In terms of unemployment among ages 25 to 29 years, the demographic groups most similar to Tongans are Immigrants from Somalia (5.5%, a difference of 0.31%), Immigrants from Cuba (5.6%, a difference of 2.4%), Somali (5.6%, a difference of 2.4%), Sudanese (5.4%, a difference of 2.5%), and Hmong (5.7%, a difference of 2.6%).
| Demographics | Rating | Rank | Unemployment Among Ages 25 to 29 years |
| Sudanese | 100.0 /100 | #1 | Exceptional 5.4% |
| Tongans | 100.0 /100 | #2 | Exceptional 5.5% |
| Immigrants | Somalia | 100.0 /100 | #3 | Exceptional 5.5% |
| Immigrants | Cuba | 100.0 /100 | #4 | Exceptional 5.6% |
| Somalis | 100.0 /100 | #5 | Exceptional 5.6% |
| Hmong | 100.0 /100 | #6 | Exceptional 5.7% |
| Immigrants | India | 100.0 /100 | #7 | Exceptional 5.7% |
| Immigrants | Bosnia and Herzegovina | 100.0 /100 | #8 | Exceptional 5.7% |
| Immigrants | Nepal | 100.0 /100 | #9 | Exceptional 5.7% |
| Immigrants | Sudan | 100.0 /100 | #10 | Exceptional 5.8% |
| Cambodians | 100.0 /100 | #11 | Exceptional 5.8% |
| Okinawans | 100.0 /100 | #12 | Exceptional 5.9% |
| Immigrants | Bolivia | 100.0 /100 | #13 | Exceptional 5.9% |
| Immigrants | Kuwait | 99.9 /100 | #14 | Exceptional 5.9% |
| Cubans | 99.9 /100 | #15 | Exceptional 5.9% |
Demographics Similar to Tlingit-Haida by Unemployment Among Ages 25 to 29 years
In terms of unemployment among ages 25 to 29 years, the demographic groups most similar to Tlingit-Haida are Dominican (8.7%, a difference of 0.10%), Houma (8.7%, a difference of 0.45%), Immigrants from Dominican Republic (8.6%, a difference of 0.78%), Yakama (8.8%, a difference of 0.96%), and Black/African American (8.6%, a difference of 1.4%).
| Demographics | Rating | Rank | Unemployment Among Ages 25 to 29 years |
| British West Indians | 0.0 /100 | #315 | Tragic 8.4% |
| Immigrants | Grenada | 0.0 /100 | #316 | Tragic 8.4% |
| Immigrants | Guyana | 0.0 /100 | #317 | Tragic 8.5% |
| Guyanese | 0.0 /100 | #318 | Tragic 8.5% |
| Immigrants | Armenia | 0.0 /100 | #319 | Tragic 8.5% |
| Blacks/African Americans | 0.0 /100 | #320 | Tragic 8.6% |
| Immigrants | Dominican Republic | 0.0 /100 | #321 | Tragic 8.6% |
| Tlingit-Haida | 0.0 /100 | #322 | Tragic 8.7% |
| Dominicans | 0.0 /100 | #323 | Tragic 8.7% |
| Houma | 0.0 /100 | #324 | Tragic 8.7% |
| Yakama | 0.0 /100 | #325 | Tragic 8.8% |
| Shoshone | 0.0 /100 | #326 | Tragic 9.2% |
| Colville | 0.0 /100 | #327 | Tragic 9.2% |
| Apache | 0.0 /100 | #328 | Tragic 9.5% |
| Aleuts | 0.0 /100 | #329 | Tragic 9.7% |