Scotch-Irish vs Immigrants from Eritrea Unemployment Among Ages 60 to 64 years
COMPARE
Scotch-Irish
Immigrants from Eritrea
Unemployment Among Ages 60 to 64 years
Unemployment Among Ages 60 to 64 years Comparison
Scotch-Irish
Immigrants from Eritrea
4.6%
UNEMPLOYMENT AMONG AGES 60 TO 64 YEARS
99.9/ 100
METRIC RATING
49th/ 347
METRIC RANK
4.5%
UNEMPLOYMENT AMONG AGES 60 TO 64 YEARS
100.0/ 100
METRIC RATING
31st/ 347
METRIC RANK
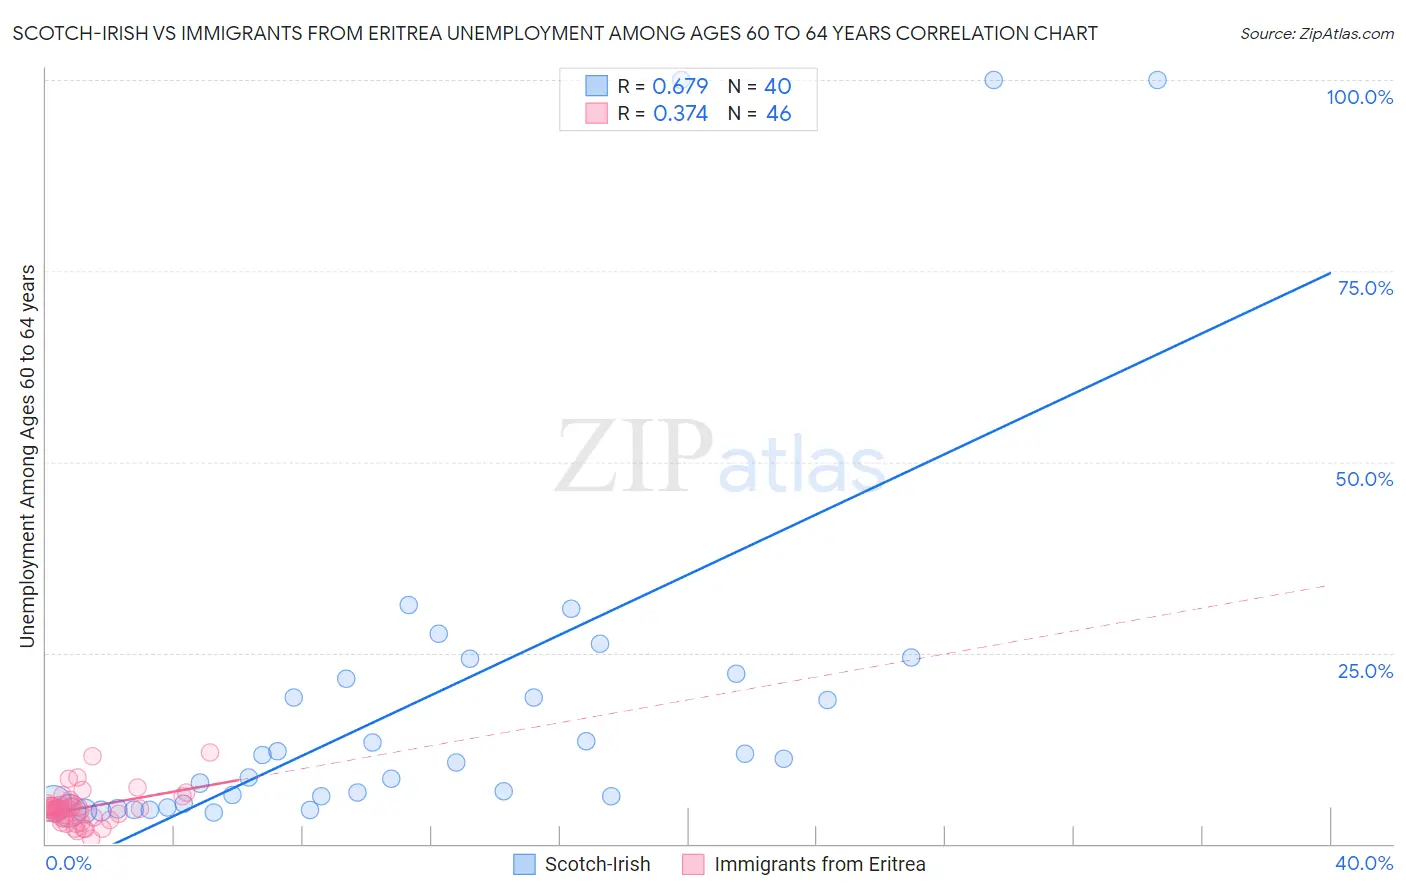
Scotch-Irish vs Immigrants from Eritrea Unemployment Among Ages 60 to 64 years Correlation Chart
The statistical analysis conducted on geographies consisting of 450,645,011 people shows a significant positive correlation between the proportion of Scotch-Irish and unemployment rate among population between the ages 60 and 64 in the United States with a correlation coefficient (R) of 0.679 and weighted average of 4.6%. Similarly, the statistical analysis conducted on geographies consisting of 101,843,192 people shows a mild positive correlation between the proportion of Immigrants from Eritrea and unemployment rate among population between the ages 60 and 64 in the United States with a correlation coefficient (R) of 0.374 and weighted average of 4.5%, a difference of 1.9%.
Unemployment Among Ages 60 to 64 years Correlation Summary
| Measurement | Scotch-Irish | Immigrants from Eritrea |
| Minimum | 4.0% | 0.60% |
| Maximum | 100.0% | 12.0% |
| Range | 96.0% | 11.4% |
| Mean | 18.9% | 4.7% |
| Median | 10.9% | 4.6% |
| Interquartile 25% (IQ1) | 5.3% | 3.2% |
| Interquartile 75% (IQ3) | 21.9% | 5.0% |
| Interquartile Range (IQR) | 16.6% | 1.8% |
| Standard Deviation (Sample) | 24.8% | 2.3% |
| Standard Deviation (Population) | 24.5% | 2.3% |
Demographics Similar to Scotch-Irish and Immigrants from Eritrea by Unemployment Among Ages 60 to 64 years
In terms of unemployment among ages 60 to 64 years, the demographic groups most similar to Scotch-Irish are Scottish (4.6%, a difference of 0.030%), Immigrants from Zimbabwe (4.6%, a difference of 0.050%), Assyrian/Chaldean/Syriac (4.5%, a difference of 0.27%), Bhutanese (4.5%, a difference of 0.46%), and Liberian (4.5%, a difference of 0.54%). Similarly, the demographic groups most similar to Immigrants from Eritrea are Zimbabwean (4.5%, a difference of 0.040%), Immigrants from Venezuela (4.5%, a difference of 0.070%), Carpatho Rusyn (4.5%, a difference of 0.090%), Belgian (4.5%, a difference of 0.35%), and German (4.5%, a difference of 0.37%).
| Demographics | Rating | Rank | Unemployment Among Ages 60 to 64 years |
| Immigrants | Venezuela | 100.0 /100 | #30 | Exceptional 4.5% |
| Immigrants | Eritrea | 100.0 /100 | #31 | Exceptional 4.5% |
| Zimbabweans | 100.0 /100 | #32 | Exceptional 4.5% |
| Carpatho Rusyns | 100.0 /100 | #33 | Exceptional 4.5% |
| Belgians | 100.0 /100 | #34 | Exceptional 4.5% |
| Germans | 100.0 /100 | #35 | Exceptional 4.5% |
| Venezuelans | 100.0 /100 | #36 | Exceptional 4.5% |
| Immigrants | Portugal | 100.0 /100 | #37 | Exceptional 4.5% |
| Native Hawaiians | 100.0 /100 | #38 | Exceptional 4.5% |
| Iraqis | 100.0 /100 | #39 | Exceptional 4.5% |
| Scandinavians | 100.0 /100 | #40 | Exceptional 4.5% |
| Immigrants | Sudan | 100.0 /100 | #41 | Exceptional 4.5% |
| English | 100.0 /100 | #42 | Exceptional 4.5% |
| Swedes | 100.0 /100 | #43 | Exceptional 4.5% |
| Europeans | 100.0 /100 | #44 | Exceptional 4.5% |
| Liberians | 99.9 /100 | #45 | Exceptional 4.5% |
| Bhutanese | 99.9 /100 | #46 | Exceptional 4.5% |
| Assyrians/Chaldeans/Syriacs | 99.9 /100 | #47 | Exceptional 4.5% |
| Immigrants | Zimbabwe | 99.9 /100 | #48 | Exceptional 4.6% |
| Scotch-Irish | 99.9 /100 | #49 | Exceptional 4.6% |
| Scottish | 99.9 /100 | #50 | Exceptional 4.6% |