Immigrants from Sierra Leone vs Immigrants from Netherlands Unemployment Among Ages 20 to 24 years
COMPARE
Immigrants from Sierra Leone
Immigrants from Netherlands
Unemployment Among Ages 20 to 24 years
Unemployment Among Ages 20 to 24 years Comparison
Immigrants from Sierra Leone
Immigrants from Netherlands
12.1%
UNEMPLOYMENT AMONG AGES 20 TO 24 YEARS
0.0/ 100
METRIC RATING
301st/ 347
METRIC RANK
9.9%
UNEMPLOYMENT AMONG AGES 20 TO 24 YEARS
98.2/ 100
METRIC RATING
80th/ 347
METRIC RANK
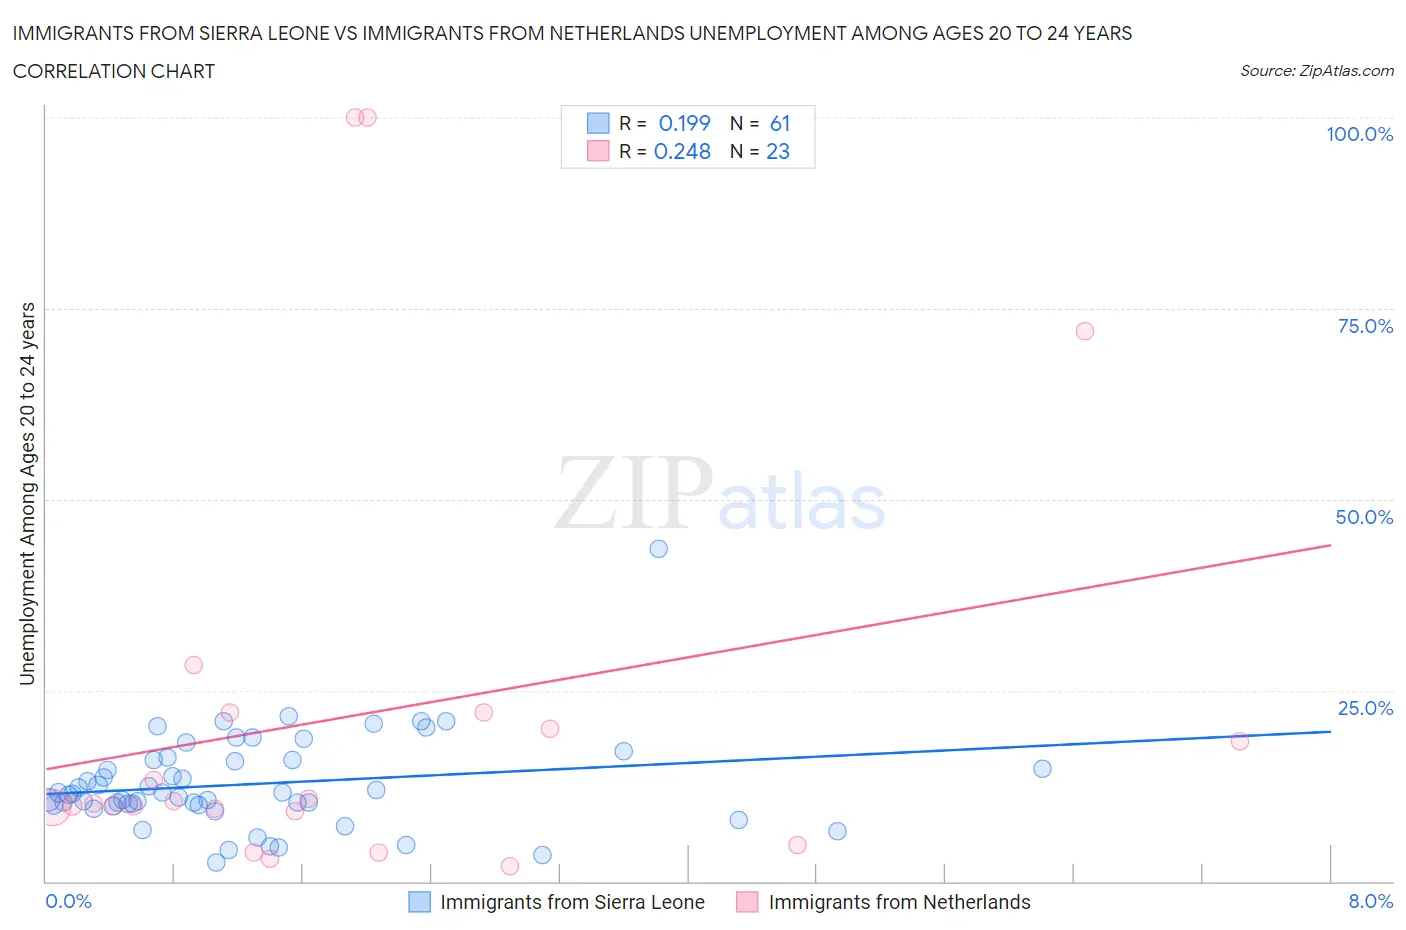
Immigrants from Sierra Leone vs Immigrants from Netherlands Unemployment Among Ages 20 to 24 years Correlation Chart
The statistical analysis conducted on geographies consisting of 101,003,153 people shows a poor positive correlation between the proportion of Immigrants from Sierra Leone and unemployment rate among population between the ages 20 and 24 in the United States with a correlation coefficient (R) of 0.199 and weighted average of 12.1%. Similarly, the statistical analysis conducted on geographies consisting of 232,390,295 people shows a weak positive correlation between the proportion of Immigrants from Netherlands and unemployment rate among population between the ages 20 and 24 in the United States with a correlation coefficient (R) of 0.248 and weighted average of 9.9%, a difference of 22.0%.
Unemployment Among Ages 20 to 24 years Correlation Summary
| Measurement | Immigrants from Sierra Leone | Immigrants from Netherlands |
| Minimum | 2.5% | 2.0% |
| Maximum | 43.6% | 100.0% |
| Range | 41.1% | 98.0% |
| Mean | 12.7% | 21.9% |
| Median | 11.5% | 10.2% |
| Interquartile 25% (IQ1) | 10.0% | 9.2% |
| Interquartile 75% (IQ3) | 15.9% | 22.1% |
| Interquartile Range (IQR) | 5.9% | 12.9% |
| Standard Deviation (Sample) | 6.3% | 28.5% |
| Standard Deviation (Population) | 6.2% | 27.8% |
Similar Demographics by Unemployment Among Ages 20 to 24 years
Demographics Similar to Immigrants from Sierra Leone by Unemployment Among Ages 20 to 24 years
In terms of unemployment among ages 20 to 24 years, the demographic groups most similar to Immigrants from Sierra Leone are Spanish American Indian (12.1%, a difference of 0.49%), Apache (12.0%, a difference of 0.64%), Lumbee (12.0%, a difference of 0.67%), Immigrants from Cabo Verde (12.2%, a difference of 0.85%), and Haitian (12.2%, a difference of 0.87%).
| Demographics | Rating | Rank | Unemployment Among Ages 20 to 24 years |
| Immigrants | Belize | 0.0 /100 | #294 | Tragic 12.0% |
| Immigrants | Armenia | 0.0 /100 | #295 | Tragic 12.0% |
| Cajuns | 0.0 /100 | #296 | Tragic 12.0% |
| Blackfeet | 0.0 /100 | #297 | Tragic 12.0% |
| Lumbee | 0.0 /100 | #298 | Tragic 12.0% |
| Apache | 0.0 /100 | #299 | Tragic 12.0% |
| Spanish American Indians | 0.0 /100 | #300 | Tragic 12.1% |
| Immigrants | Sierra Leone | 0.0 /100 | #301 | Tragic 12.1% |
| Immigrants | Cabo Verde | 0.0 /100 | #302 | Tragic 12.2% |
| Haitians | 0.0 /100 | #303 | Tragic 12.2% |
| Immigrants | West Indies | 0.0 /100 | #304 | Tragic 12.3% |
| Chippewa | 0.0 /100 | #305 | Tragic 12.3% |
| Immigrants | Haiti | 0.0 /100 | #306 | Tragic 12.4% |
| Bermudans | 0.0 /100 | #307 | Tragic 12.5% |
| Tohono O'odham | 0.0 /100 | #308 | Tragic 12.5% |
Demographics Similar to Immigrants from Netherlands by Unemployment Among Ages 20 to 24 years
In terms of unemployment among ages 20 to 24 years, the demographic groups most similar to Immigrants from Netherlands are Icelander (9.9%, a difference of 0.040%), Assyrian/Chaldean/Syriac (9.9%, a difference of 0.070%), Chickasaw (9.9%, a difference of 0.10%), Yaqui (9.9%, a difference of 0.11%), and Czechoslovakian (9.9%, a difference of 0.12%).
| Demographics | Rating | Rank | Unemployment Among Ages 20 to 24 years |
| Kenyans | 98.7 /100 | #73 | Exceptional 9.9% |
| Immigrants | Laos | 98.7 /100 | #74 | Exceptional 9.9% |
| Immigrants | Australia | 98.6 /100 | #75 | Exceptional 9.9% |
| Czechoslovakians | 98.4 /100 | #76 | Exceptional 9.9% |
| Chickasaw | 98.4 /100 | #77 | Exceptional 9.9% |
| Assyrians/Chaldeans/Syriacs | 98.3 /100 | #78 | Exceptional 9.9% |
| Icelanders | 98.3 /100 | #79 | Exceptional 9.9% |
| Immigrants | Netherlands | 98.2 /100 | #80 | Exceptional 9.9% |
| Yaqui | 98.0 /100 | #81 | Exceptional 9.9% |
| Sri Lankans | 98.0 /100 | #82 | Exceptional 9.9% |
| Immigrants | Bulgaria | 98.0 /100 | #83 | Exceptional 9.9% |
| Latvians | 97.9 /100 | #84 | Exceptional 9.9% |
| New Zealanders | 97.8 /100 | #85 | Exceptional 9.9% |
| Immigrants | Vietnam | 97.5 /100 | #86 | Exceptional 10.0% |
| Immigrants | Oceania | 97.4 /100 | #87 | Exceptional 10.0% |