Yakama vs Immigrants from Lebanon Unemployment Among Ages 60 to 64 years
COMPARE
Yakama
Immigrants from Lebanon
Unemployment Among Ages 60 to 64 years
Unemployment Among Ages 60 to 64 years Comparison
Yakama
Immigrants from Lebanon
6.0%
UNEMPLOYMENT AMONG AGES 60 TO 64 YEARS
0.0/ 100
METRIC RATING
331st/ 347
METRIC RANK
4.8%
UNEMPLOYMENT AMONG AGES 60 TO 64 YEARS
89.6/ 100
METRIC RATING
131st/ 347
METRIC RANK
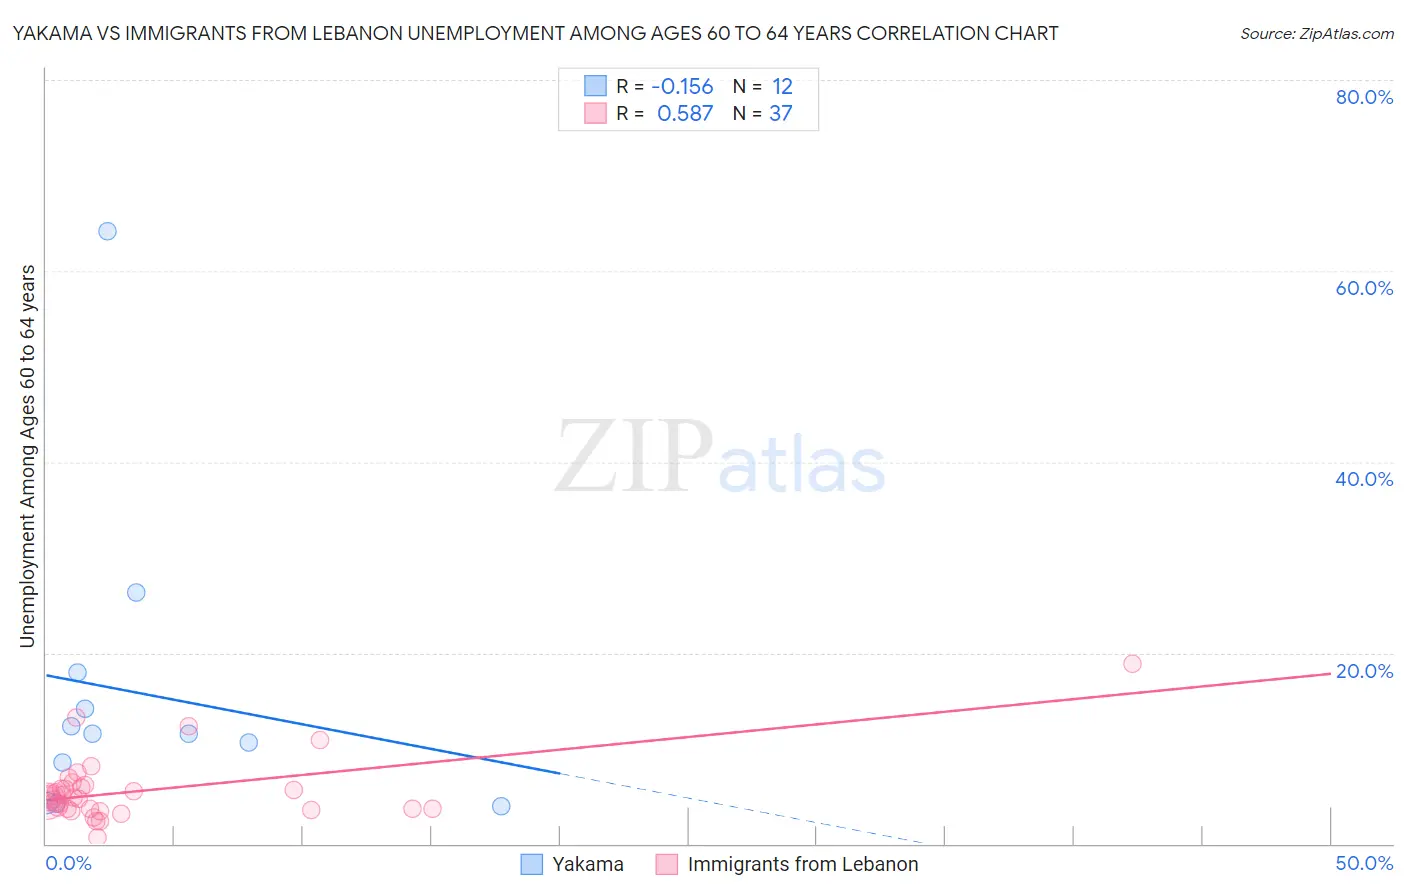
Yakama vs Immigrants from Lebanon Unemployment Among Ages 60 to 64 years Correlation Chart
The statistical analysis conducted on geographies consisting of 19,157,161 people shows a poor negative correlation between the proportion of Yakama and unemployment rate among population between the ages 60 and 64 in the United States with a correlation coefficient (R) of -0.156 and weighted average of 6.0%. Similarly, the statistical analysis conducted on geographies consisting of 207,036,790 people shows a substantial positive correlation between the proportion of Immigrants from Lebanon and unemployment rate among population between the ages 60 and 64 in the United States with a correlation coefficient (R) of 0.587 and weighted average of 4.8%, a difference of 25.4%.
Unemployment Among Ages 60 to 64 years Correlation Summary
| Measurement | Yakama | Immigrants from Lebanon |
| Minimum | 3.9% | 0.60% |
| Maximum | 64.2% | 18.9% |
| Range | 60.3% | 18.3% |
| Mean | 15.8% | 5.6% |
| Median | 11.5% | 4.7% |
| Interquartile 25% (IQ1) | 6.4% | 3.7% |
| Interquartile 75% (IQ3) | 16.0% | 6.0% |
| Interquartile Range (IQR) | 9.6% | 2.3% |
| Standard Deviation (Sample) | 16.5% | 3.4% |
| Standard Deviation (Population) | 15.8% | 3.4% |
Similar Demographics by Unemployment Among Ages 60 to 64 years
Demographics Similar to Yakama by Unemployment Among Ages 60 to 64 years
In terms of unemployment among ages 60 to 64 years, the demographic groups most similar to Yakama are Dominican (6.0%, a difference of 0.020%), Immigrants from Armenia (6.0%, a difference of 0.14%), Immigrants from Dominican Republic (6.0%, a difference of 0.37%), Apache (6.0%, a difference of 0.40%), and Immigrants from Bangladesh (6.0%, a difference of 0.40%).
| Demographics | Rating | Rank | Unemployment Among Ages 60 to 64 years |
| Immigrants | Ecuador | 0.0 /100 | #324 | Tragic 5.8% |
| Paiute | 0.0 /100 | #325 | Tragic 5.8% |
| Immigrants | St. Vincent and the Grenadines | 0.0 /100 | #326 | Tragic 5.9% |
| Immigrants | Grenada | 0.0 /100 | #327 | Tragic 5.9% |
| Apache | 0.0 /100 | #328 | Tragic 6.0% |
| Immigrants | Bangladesh | 0.0 /100 | #329 | Tragic 6.0% |
| Immigrants | Armenia | 0.0 /100 | #330 | Tragic 6.0% |
| Yakama | 0.0 /100 | #331 | Tragic 6.0% |
| Dominicans | 0.0 /100 | #332 | Tragic 6.0% |
| Immigrants | Dominican Republic | 0.0 /100 | #333 | Tragic 6.0% |
| Puerto Ricans | 0.0 /100 | #334 | Tragic 6.1% |
| Vietnamese | 0.0 /100 | #335 | Tragic 6.1% |
| Kiowa | 0.0 /100 | #336 | Tragic 6.2% |
| Navajo | 0.0 /100 | #337 | Tragic 6.3% |
| Arapaho | 0.0 /100 | #338 | Tragic 6.3% |
Demographics Similar to Immigrants from Lebanon by Unemployment Among Ages 60 to 64 years
In terms of unemployment among ages 60 to 64 years, the demographic groups most similar to Immigrants from Lebanon are Lithuanian (4.8%, a difference of 0.0%), Yaqui (4.8%, a difference of 0.010%), Immigrants from Syria (4.8%, a difference of 0.050%), Immigrants from Serbia (4.8%, a difference of 0.060%), and Choctaw (4.8%, a difference of 0.070%).
| Demographics | Rating | Rank | Unemployment Among Ages 60 to 64 years |
| Immigrants | Senegal | 94.5 /100 | #124 | Exceptional 4.7% |
| Immigrants | Thailand | 93.7 /100 | #125 | Exceptional 4.7% |
| Immigrants | South Central Asia | 93.0 /100 | #126 | Exceptional 4.7% |
| Austrians | 91.9 /100 | #127 | Exceptional 4.8% |
| Choctaw | 90.3 /100 | #128 | Exceptional 4.8% |
| Immigrants | Serbia | 90.2 /100 | #129 | Exceptional 4.8% |
| Immigrants | Syria | 90.1 /100 | #130 | Exceptional 4.8% |
| Immigrants | Lebanon | 89.6 /100 | #131 | Excellent 4.8% |
| Lithuanians | 89.6 /100 | #132 | Excellent 4.8% |
| Yaqui | 89.5 /100 | #133 | Excellent 4.8% |
| Basques | 88.8 /100 | #134 | Excellent 4.8% |
| Pennsylvania Germans | 87.8 /100 | #135 | Excellent 4.8% |
| French Canadians | 87.6 /100 | #136 | Excellent 4.8% |
| Cambodians | 86.9 /100 | #137 | Excellent 4.8% |
| Immigrants | Lithuania | 86.7 /100 | #138 | Excellent 4.8% |