Scandinavian vs Immigrants from Kenya Unemployment Among Ages 20 to 24 years
COMPARE
Scandinavian
Immigrants from Kenya
Unemployment Among Ages 20 to 24 years
Unemployment Among Ages 20 to 24 years Comparison
Scandinavians
Immigrants from Kenya
9.5%
UNEMPLOYMENT AMONG AGES 20 TO 24 YEARS
100.0/ 100
METRIC RATING
30th/ 347
METRIC RANK
9.7%
UNEMPLOYMENT AMONG AGES 20 TO 24 YEARS
99.7/ 100
METRIC RATING
50th/ 347
METRIC RANK
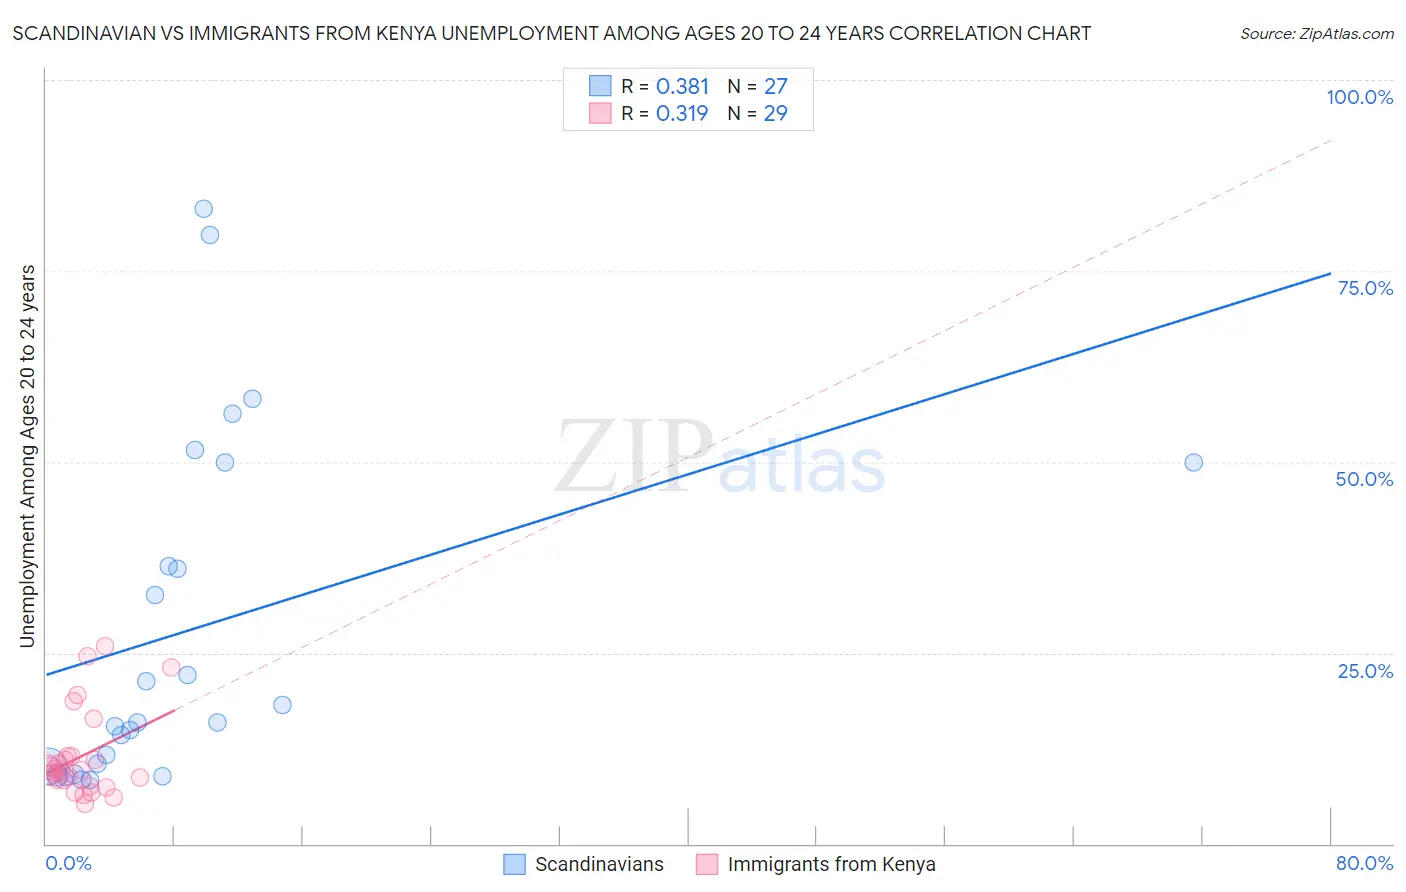
Scandinavian vs Immigrants from Kenya Unemployment Among Ages 20 to 24 years Correlation Chart
The statistical analysis conducted on geographies consisting of 445,642,981 people shows a mild positive correlation between the proportion of Scandinavians and unemployment rate among population between the ages 20 and 24 in the United States with a correlation coefficient (R) of 0.381 and weighted average of 9.5%. Similarly, the statistical analysis conducted on geographies consisting of 215,675,532 people shows a mild positive correlation between the proportion of Immigrants from Kenya and unemployment rate among population between the ages 20 and 24 in the United States with a correlation coefficient (R) of 0.319 and weighted average of 9.7%, a difference of 2.3%.
Unemployment Among Ages 20 to 24 years Correlation Summary
| Measurement | Scandinavian | Immigrants from Kenya |
| Minimum | 8.3% | 5.2% |
| Maximum | 83.1% | 25.8% |
| Range | 74.7% | 20.6% |
| Mean | 28.0% | 11.4% |
| Median | 15.9% | 9.7% |
| Interquartile 25% (IQ1) | 10.1% | 8.0% |
| Interquartile 75% (IQ3) | 50.0% | 11.5% |
| Interquartile Range (IQR) | 39.9% | 3.5% |
| Standard Deviation (Sample) | 22.6% | 5.6% |
| Standard Deviation (Population) | 22.1% | 5.5% |
Demographics Similar to Scandinavians and Immigrants from Kenya by Unemployment Among Ages 20 to 24 years
In terms of unemployment among ages 20 to 24 years, the demographic groups most similar to Scandinavians are Immigrants from Eastern Africa (9.5%, a difference of 0.090%), Cambodian (9.5%, a difference of 0.13%), Australian (9.6%, a difference of 0.24%), Yugoslavian (9.6%, a difference of 0.44%), and German (9.6%, a difference of 0.52%). Similarly, the demographic groups most similar to Immigrants from Kenya are Creek (9.7%, a difference of 0.14%), Finnish (9.7%, a difference of 0.22%), Immigrants from India (9.7%, a difference of 0.23%), Immigrants from Nicaragua (9.7%, a difference of 0.35%), and Croatian (9.7%, a difference of 0.36%).
| Demographics | Rating | Rank | Unemployment Among Ages 20 to 24 years |
| Scandinavians | 100.0 /100 | #30 | Exceptional 9.5% |
| Immigrants | Eastern Africa | 100.0 /100 | #31 | Exceptional 9.5% |
| Cambodians | 100.0 /100 | #32 | Exceptional 9.5% |
| Australians | 100.0 /100 | #33 | Exceptional 9.6% |
| Yugoslavians | 100.0 /100 | #34 | Exceptional 9.6% |
| Germans | 100.0 /100 | #35 | Exceptional 9.6% |
| Belgians | 100.0 /100 | #36 | Exceptional 9.6% |
| Immigrants | Zaire | 100.0 /100 | #37 | Exceptional 9.6% |
| Afghans | 99.9 /100 | #38 | Exceptional 9.6% |
| Dutch | 99.9 /100 | #39 | Exceptional 9.6% |
| Immigrants | Ethiopia | 99.9 /100 | #40 | Exceptional 9.6% |
| Swiss | 99.9 /100 | #41 | Exceptional 9.7% |
| Immigrants | Saudi Arabia | 99.9 /100 | #42 | Exceptional 9.7% |
| Menominee | 99.8 /100 | #43 | Exceptional 9.7% |
| Europeans | 99.8 /100 | #44 | Exceptional 9.7% |
| Croatians | 99.8 /100 | #45 | Exceptional 9.7% |
| Immigrants | Nicaragua | 99.8 /100 | #46 | Exceptional 9.7% |
| Immigrants | India | 99.8 /100 | #47 | Exceptional 9.7% |
| Finns | 99.8 /100 | #48 | Exceptional 9.7% |
| Creek | 99.8 /100 | #49 | Exceptional 9.7% |
| Immigrants | Kenya | 99.7 /100 | #50 | Exceptional 9.7% |