Immigrants from Western Europe vs Immigrants from Kenya Unemployment Among Ages 20 to 24 years
COMPARE
Immigrants from Western Europe
Immigrants from Kenya
Unemployment Among Ages 20 to 24 years
Unemployment Among Ages 20 to 24 years Comparison
Immigrants from Western Europe
Immigrants from Kenya
10.4%
UNEMPLOYMENT AMONG AGES 20 TO 24 YEARS
35.0/ 100
METRIC RATING
187th/ 347
METRIC RANK
9.7%
UNEMPLOYMENT AMONG AGES 20 TO 24 YEARS
99.7/ 100
METRIC RATING
50th/ 347
METRIC RANK
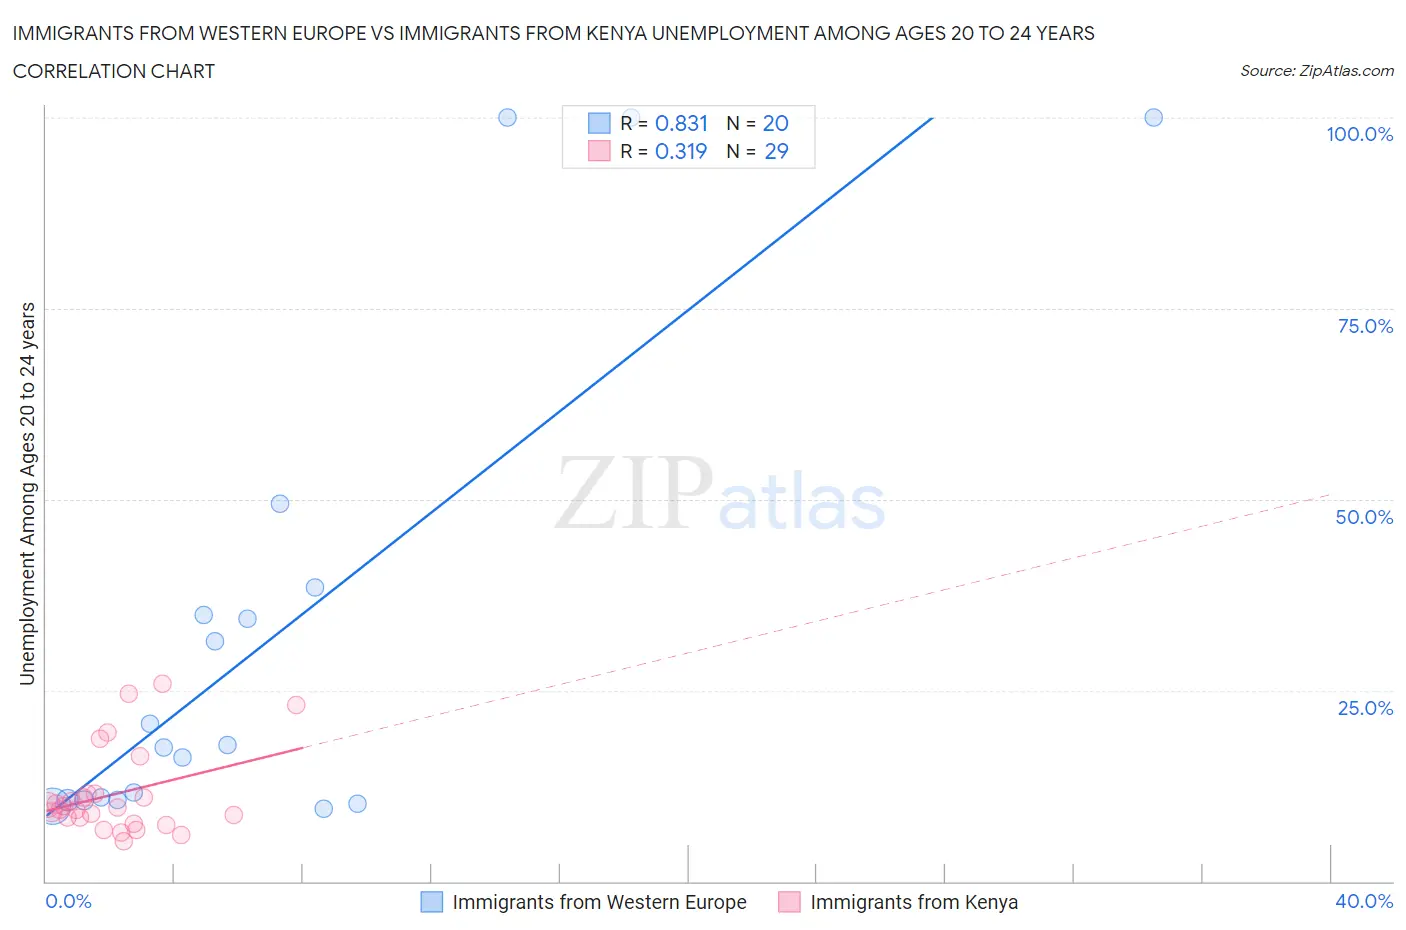
Immigrants from Western Europe vs Immigrants from Kenya Unemployment Among Ages 20 to 24 years Correlation Chart
The statistical analysis conducted on geographies consisting of 468,620,883 people shows a very strong positive correlation between the proportion of Immigrants from Western Europe and unemployment rate among population between the ages 20 and 24 in the United States with a correlation coefficient (R) of 0.831 and weighted average of 10.4%. Similarly, the statistical analysis conducted on geographies consisting of 215,675,532 people shows a mild positive correlation between the proportion of Immigrants from Kenya and unemployment rate among population between the ages 20 and 24 in the United States with a correlation coefficient (R) of 0.319 and weighted average of 9.7%, a difference of 6.4%.
Unemployment Among Ages 20 to 24 years Correlation Summary
| Measurement | Immigrants from Western Europe | Immigrants from Kenya |
| Minimum | 9.5% | 5.2% |
| Maximum | 100.0% | 25.8% |
| Range | 90.5% | 20.6% |
| Mean | 32.2% | 11.4% |
| Median | 17.7% | 9.7% |
| Interquartile 25% (IQ1) | 10.6% | 8.0% |
| Interquartile 75% (IQ3) | 36.7% | 11.5% |
| Interquartile Range (IQR) | 26.0% | 3.5% |
| Standard Deviation (Sample) | 31.4% | 5.6% |
| Standard Deviation (Population) | 30.6% | 5.5% |
Similar Demographics by Unemployment Among Ages 20 to 24 years
Demographics Similar to Immigrants from Western Europe by Unemployment Among Ages 20 to 24 years
In terms of unemployment among ages 20 to 24 years, the demographic groups most similar to Immigrants from Western Europe are Immigrants from Russia (10.4%, a difference of 0.010%), Guamanian/Chamorro (10.4%, a difference of 0.020%), Syrian (10.4%, a difference of 0.030%), Hawaiian (10.4%, a difference of 0.040%), and Greek (10.4%, a difference of 0.090%).
| Demographics | Rating | Rank | Unemployment Among Ages 20 to 24 years |
| Immigrants | Turkey | 39.3 /100 | #180 | Fair 10.3% |
| Okinawans | 39.1 /100 | #181 | Fair 10.3% |
| Immigrants | Germany | 38.1 /100 | #182 | Fair 10.4% |
| Immigrants | Egypt | 37.4 /100 | #183 | Fair 10.4% |
| Greeks | 37.2 /100 | #184 | Fair 10.4% |
| Syrians | 35.6 /100 | #185 | Fair 10.4% |
| Guamanians/Chamorros | 35.4 /100 | #186 | Fair 10.4% |
| Immigrants | Western Europe | 35.0 /100 | #187 | Fair 10.4% |
| Immigrants | Russia | 34.6 /100 | #188 | Fair 10.4% |
| Hawaiians | 33.9 /100 | #189 | Fair 10.4% |
| Immigrants | China | 32.6 /100 | #190 | Fair 10.4% |
| Immigrants | Eastern Europe | 25.8 /100 | #191 | Fair 10.4% |
| Ugandans | 25.7 /100 | #192 | Fair 10.4% |
| Immigrants | Portugal | 25.3 /100 | #193 | Fair 10.4% |
| Immigrants | Italy | 25.0 /100 | #194 | Fair 10.4% |
Demographics Similar to Immigrants from Kenya by Unemployment Among Ages 20 to 24 years
In terms of unemployment among ages 20 to 24 years, the demographic groups most similar to Immigrants from Kenya are Ethiopian (9.8%, a difference of 0.070%), Creek (9.7%, a difference of 0.14%), Immigrants from Thailand (9.8%, a difference of 0.17%), Finnish (9.7%, a difference of 0.22%), and Immigrants from India (9.7%, a difference of 0.23%).
| Demographics | Rating | Rank | Unemployment Among Ages 20 to 24 years |
| Menominee | 99.8 /100 | #43 | Exceptional 9.7% |
| Europeans | 99.8 /100 | #44 | Exceptional 9.7% |
| Croatians | 99.8 /100 | #45 | Exceptional 9.7% |
| Immigrants | Nicaragua | 99.8 /100 | #46 | Exceptional 9.7% |
| Immigrants | India | 99.8 /100 | #47 | Exceptional 9.7% |
| Finns | 99.8 /100 | #48 | Exceptional 9.7% |
| Creek | 99.8 /100 | #49 | Exceptional 9.7% |
| Immigrants | Kenya | 99.7 /100 | #50 | Exceptional 9.7% |
| Ethiopians | 99.7 /100 | #51 | Exceptional 9.8% |
| Immigrants | Thailand | 99.7 /100 | #52 | Exceptional 9.8% |
| Immigrants | Serbia | 99.6 /100 | #53 | Exceptional 9.8% |
| Immigrants | Cambodia | 99.6 /100 | #54 | Exceptional 9.8% |
| Carpatho Rusyns | 99.6 /100 | #55 | Exceptional 9.8% |
| Nicaraguans | 99.6 /100 | #56 | Exceptional 9.8% |
| Immigrants | Moldova | 99.5 /100 | #57 | Exceptional 9.8% |