Scandinavian vs Hopi Unemployment Among Ages 20 to 24 years
COMPARE
Scandinavian
Hopi
Unemployment Among Ages 20 to 24 years
Unemployment Among Ages 20 to 24 years Comparison
Scandinavians
Hopi
9.5%
UNEMPLOYMENT AMONG AGES 20 TO 24 YEARS
100.0/ 100
METRIC RATING
30th/ 347
METRIC RANK
19.9%
UNEMPLOYMENT AMONG AGES 20 TO 24 YEARS
0.0/ 100
METRIC RATING
345th/ 347
METRIC RANK
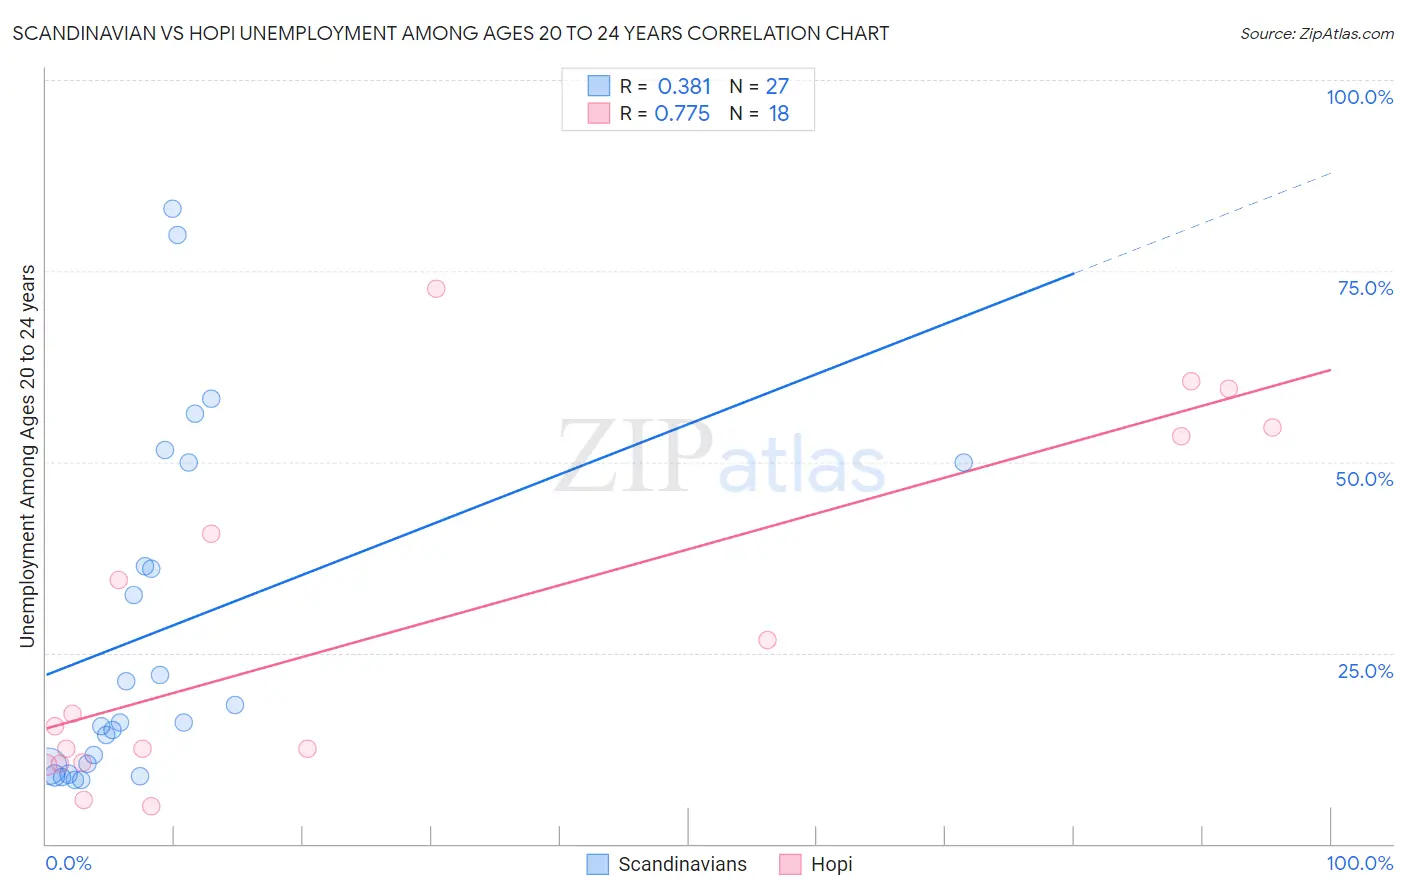
Scandinavian vs Hopi Unemployment Among Ages 20 to 24 years Correlation Chart
The statistical analysis conducted on geographies consisting of 445,642,981 people shows a mild positive correlation between the proportion of Scandinavians and unemployment rate among population between the ages 20 and 24 in the United States with a correlation coefficient (R) of 0.381 and weighted average of 9.5%. Similarly, the statistical analysis conducted on geographies consisting of 74,191,645 people shows a strong positive correlation between the proportion of Hopi and unemployment rate among population between the ages 20 and 24 in the United States with a correlation coefficient (R) of 0.775 and weighted average of 19.9%, a difference of 108.8%.
Unemployment Among Ages 20 to 24 years Correlation Summary
| Measurement | Scandinavian | Hopi |
| Minimum | 8.3% | 4.9% |
| Maximum | 83.1% | 72.7% |
| Range | 74.7% | 67.8% |
| Mean | 28.0% | 28.6% |
| Median | 15.9% | 16.2% |
| Interquartile 25% (IQ1) | 10.1% | 10.7% |
| Interquartile 75% (IQ3) | 50.0% | 53.3% |
| Interquartile Range (IQR) | 39.9% | 42.6% |
| Standard Deviation (Sample) | 22.6% | 22.4% |
| Standard Deviation (Population) | 22.1% | 21.8% |
Similar Demographics by Unemployment Among Ages 20 to 24 years
Demographics Similar to Scandinavians by Unemployment Among Ages 20 to 24 years
In terms of unemployment among ages 20 to 24 years, the demographic groups most similar to Scandinavians are Immigrants from North Macedonia (9.5%, a difference of 0.010%), Immigrants from Afghanistan (9.5%, a difference of 0.020%), Immigrants from Eastern Africa (9.5%, a difference of 0.090%), Immigrants from Zimbabwe (9.5%, a difference of 0.11%), and Cambodian (9.5%, a difference of 0.13%).
| Demographics | Rating | Rank | Unemployment Among Ages 20 to 24 years |
| Immigrants | Nepal | 100.0 /100 | #23 | Exceptional 9.4% |
| Taiwanese | 100.0 /100 | #24 | Exceptional 9.4% |
| Immigrants | Eritrea | 100.0 /100 | #25 | Exceptional 9.5% |
| Swedes | 100.0 /100 | #26 | Exceptional 9.5% |
| Immigrants | Zimbabwe | 100.0 /100 | #27 | Exceptional 9.5% |
| Immigrants | Afghanistan | 100.0 /100 | #28 | Exceptional 9.5% |
| Immigrants | North Macedonia | 100.0 /100 | #29 | Exceptional 9.5% |
| Scandinavians | 100.0 /100 | #30 | Exceptional 9.5% |
| Immigrants | Eastern Africa | 100.0 /100 | #31 | Exceptional 9.5% |
| Cambodians | 100.0 /100 | #32 | Exceptional 9.5% |
| Australians | 100.0 /100 | #33 | Exceptional 9.6% |
| Yugoslavians | 100.0 /100 | #34 | Exceptional 9.6% |
| Germans | 100.0 /100 | #35 | Exceptional 9.6% |
| Belgians | 100.0 /100 | #36 | Exceptional 9.6% |
| Immigrants | Zaire | 100.0 /100 | #37 | Exceptional 9.6% |
Demographics Similar to Hopi by Unemployment Among Ages 20 to 24 years
In terms of unemployment among ages 20 to 24 years, the demographic groups most similar to Hopi are Yup'ik (20.9%, a difference of 4.9%), Inupiat (20.9%, a difference of 5.2%), Crow (18.7%, a difference of 6.2%), Tsimshian (18.0%, a difference of 10.6%), and Puerto Rican (16.7%, a difference of 19.5%).
| Demographics | Rating | Rank | Unemployment Among Ages 20 to 24 years |
| Immigrants | Guyana | 0.0 /100 | #333 | Tragic 13.9% |
| Guyanese | 0.0 /100 | #334 | Tragic 14.0% |
| Sioux | 0.0 /100 | #335 | Tragic 14.2% |
| Pima | 0.0 /100 | #336 | Tragic 14.2% |
| Paiute | 0.0 /100 | #337 | Tragic 14.3% |
| Immigrants | St. Vincent and the Grenadines | 0.0 /100 | #338 | Tragic 14.3% |
| Immigrants | Yemen | 0.0 /100 | #339 | Tragic 14.9% |
| Yuman | 0.0 /100 | #340 | Tragic 15.8% |
| Navajo | 0.0 /100 | #341 | Tragic 16.1% |
| Puerto Ricans | 0.0 /100 | #342 | Tragic 16.7% |
| Tsimshian | 0.0 /100 | #343 | Tragic 18.0% |
| Crow | 0.0 /100 | #344 | Tragic 18.7% |
| Hopi | 0.0 /100 | #345 | Tragic 19.9% |
| Yup'ik | 0.0 /100 | #346 | Tragic 20.9% |
| Inupiat | 0.0 /100 | #347 | Tragic 20.9% |