Northern European vs Immigrants from Kenya Unemployment Among Ages 20 to 24 years
COMPARE
Northern European
Immigrants from Kenya
Unemployment Among Ages 20 to 24 years
Unemployment Among Ages 20 to 24 years Comparison
Northern Europeans
Immigrants from Kenya
10.1%
UNEMPLOYMENT AMONG AGES 20 TO 24 YEARS
92.7/ 100
METRIC RATING
112th/ 347
METRIC RANK
9.7%
UNEMPLOYMENT AMONG AGES 20 TO 24 YEARS
99.7/ 100
METRIC RATING
50th/ 347
METRIC RANK
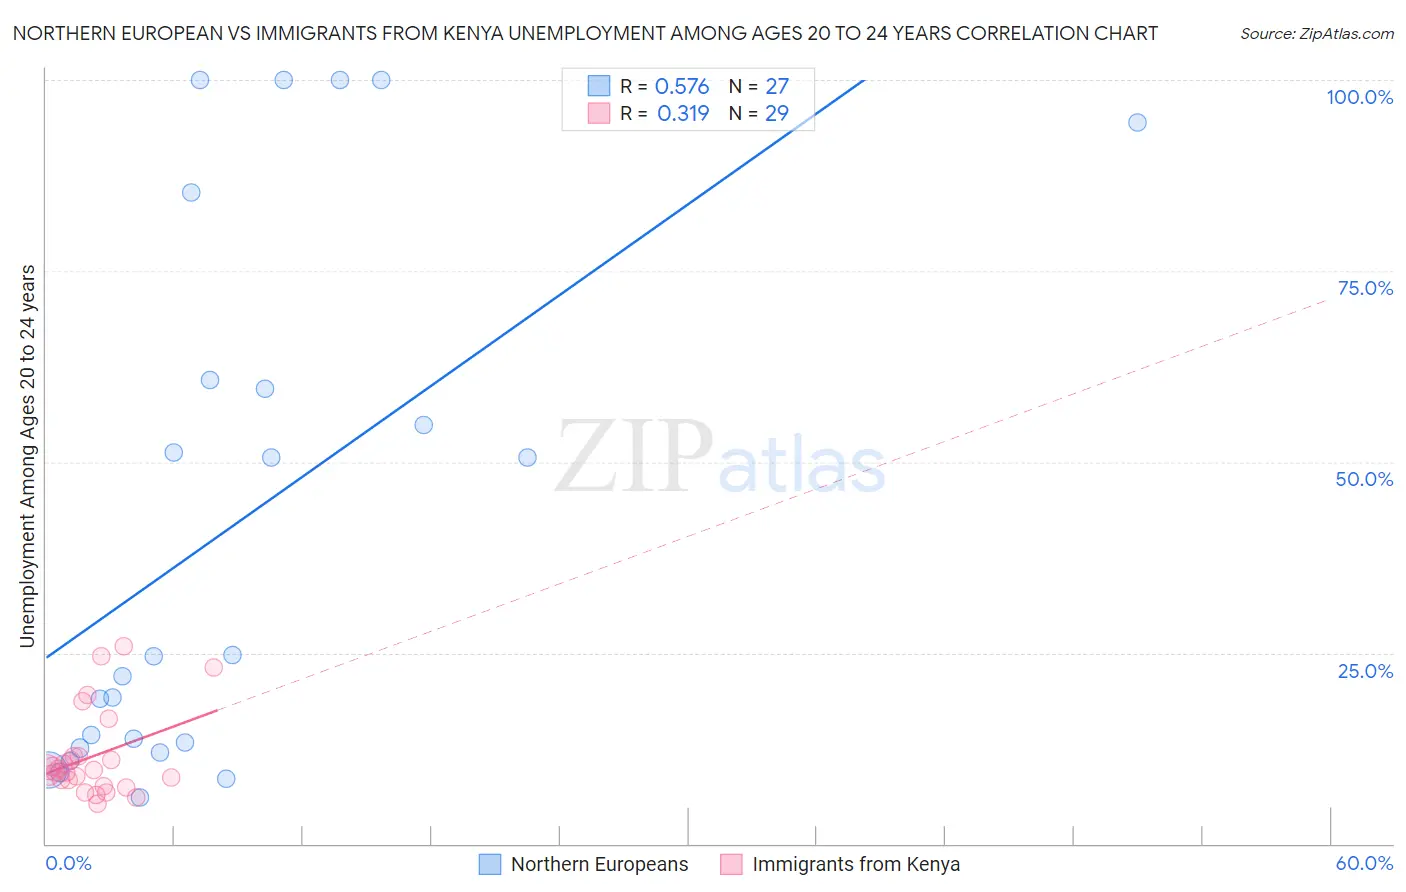
Northern European vs Immigrants from Kenya Unemployment Among Ages 20 to 24 years Correlation Chart
The statistical analysis conducted on geographies consisting of 389,153,770 people shows a substantial positive correlation between the proportion of Northern Europeans and unemployment rate among population between the ages 20 and 24 in the United States with a correlation coefficient (R) of 0.576 and weighted average of 10.1%. Similarly, the statistical analysis conducted on geographies consisting of 215,675,532 people shows a mild positive correlation between the proportion of Immigrants from Kenya and unemployment rate among population between the ages 20 and 24 in the United States with a correlation coefficient (R) of 0.319 and weighted average of 9.7%, a difference of 3.3%.
Unemployment Among Ages 20 to 24 years Correlation Summary
| Measurement | Northern European | Immigrants from Kenya |
| Minimum | 6.0% | 5.2% |
| Maximum | 100.0% | 25.8% |
| Range | 94.0% | 20.6% |
| Mean | 41.7% | 11.4% |
| Median | 24.6% | 9.7% |
| Interquartile 25% (IQ1) | 12.5% | 8.0% |
| Interquartile 75% (IQ3) | 60.7% | 11.5% |
| Interquartile Range (IQR) | 48.2% | 3.5% |
| Standard Deviation (Sample) | 34.4% | 5.6% |
| Standard Deviation (Population) | 33.8% | 5.5% |
Similar Demographics by Unemployment Among Ages 20 to 24 years
Demographics Similar to Northern Europeans by Unemployment Among Ages 20 to 24 years
In terms of unemployment among ages 20 to 24 years, the demographic groups most similar to Northern Europeans are Immigrants from Indonesia (10.1%, a difference of 0.010%), German Russian (10.1%, a difference of 0.030%), Immigrants from Spain (10.1%, a difference of 0.070%), Immigrants from Latvia (10.1%, a difference of 0.080%), and Filipino (10.1%, a difference of 0.080%).
| Demographics | Rating | Rank | Unemployment Among Ages 20 to 24 years |
| Immigrants | Hungary | 94.0 /100 | #105 | Exceptional 10.0% |
| Pennsylvania Germans | 93.9 /100 | #106 | Exceptional 10.0% |
| Iroquois | 93.4 /100 | #107 | Exceptional 10.1% |
| Immigrants | Latvia | 93.2 /100 | #108 | Exceptional 10.1% |
| Filipinos | 93.2 /100 | #109 | Exceptional 10.1% |
| Immigrants | Spain | 93.1 /100 | #110 | Exceptional 10.1% |
| Immigrants | Indonesia | 92.7 /100 | #111 | Exceptional 10.1% |
| Northern Europeans | 92.7 /100 | #112 | Exceptional 10.1% |
| German Russians | 92.4 /100 | #113 | Exceptional 10.1% |
| Ottawa | 90.8 /100 | #114 | Exceptional 10.1% |
| Immigrants | Morocco | 90.5 /100 | #115 | Exceptional 10.1% |
| Basques | 89.8 /100 | #116 | Excellent 10.1% |
| Immigrants | Uruguay | 89.6 /100 | #117 | Excellent 10.1% |
| Paraguayans | 88.6 /100 | #118 | Excellent 10.1% |
| French | 88.2 /100 | #119 | Excellent 10.1% |
Demographics Similar to Immigrants from Kenya by Unemployment Among Ages 20 to 24 years
In terms of unemployment among ages 20 to 24 years, the demographic groups most similar to Immigrants from Kenya are Ethiopian (9.8%, a difference of 0.070%), Creek (9.7%, a difference of 0.14%), Immigrants from Thailand (9.8%, a difference of 0.17%), Finnish (9.7%, a difference of 0.22%), and Immigrants from India (9.7%, a difference of 0.23%).
| Demographics | Rating | Rank | Unemployment Among Ages 20 to 24 years |
| Menominee | 99.8 /100 | #43 | Exceptional 9.7% |
| Europeans | 99.8 /100 | #44 | Exceptional 9.7% |
| Croatians | 99.8 /100 | #45 | Exceptional 9.7% |
| Immigrants | Nicaragua | 99.8 /100 | #46 | Exceptional 9.7% |
| Immigrants | India | 99.8 /100 | #47 | Exceptional 9.7% |
| Finns | 99.8 /100 | #48 | Exceptional 9.7% |
| Creek | 99.8 /100 | #49 | Exceptional 9.7% |
| Immigrants | Kenya | 99.7 /100 | #50 | Exceptional 9.7% |
| Ethiopians | 99.7 /100 | #51 | Exceptional 9.8% |
| Immigrants | Thailand | 99.7 /100 | #52 | Exceptional 9.8% |
| Immigrants | Serbia | 99.6 /100 | #53 | Exceptional 9.8% |
| Immigrants | Cambodia | 99.6 /100 | #54 | Exceptional 9.8% |
| Carpatho Rusyns | 99.6 /100 | #55 | Exceptional 9.8% |
| Nicaraguans | 99.6 /100 | #56 | Exceptional 9.8% |
| Immigrants | Moldova | 99.5 /100 | #57 | Exceptional 9.8% |