Scandinavian vs Immigrants from Asia Unemployment Among Ages 20 to 24 years
COMPARE
Scandinavian
Immigrants from Asia
Unemployment Among Ages 20 to 24 years
Unemployment Among Ages 20 to 24 years Comparison
Scandinavians
Immigrants from Asia
9.5%
UNEMPLOYMENT AMONG AGES 20 TO 24 YEARS
100.0/ 100
METRIC RATING
30th/ 347
METRIC RANK
10.3%
UNEMPLOYMENT AMONG AGES 20 TO 24 YEARS
61.3/ 100
METRIC RATING
162nd/ 347
METRIC RANK
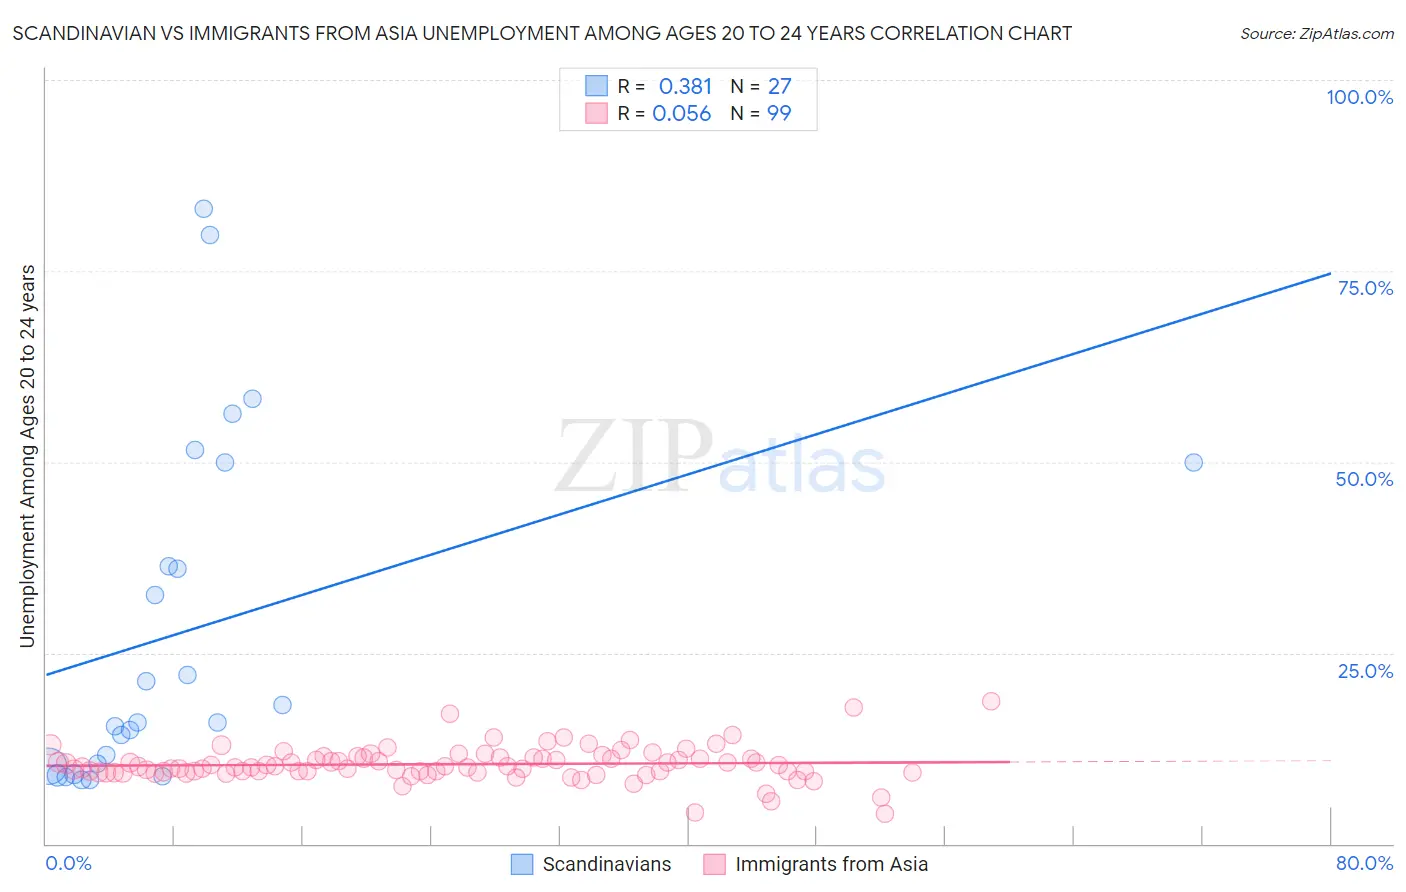
Scandinavian vs Immigrants from Asia Unemployment Among Ages 20 to 24 years Correlation Chart
The statistical analysis conducted on geographies consisting of 445,642,981 people shows a mild positive correlation between the proportion of Scandinavians and unemployment rate among population between the ages 20 and 24 in the United States with a correlation coefficient (R) of 0.381 and weighted average of 9.5%. Similarly, the statistical analysis conducted on geographies consisting of 512,849,393 people shows a slight positive correlation between the proportion of Immigrants from Asia and unemployment rate among population between the ages 20 and 24 in the United States with a correlation coefficient (R) of 0.056 and weighted average of 10.3%, a difference of 7.7%.
Unemployment Among Ages 20 to 24 years Correlation Summary
| Measurement | Scandinavian | Immigrants from Asia |
| Minimum | 8.3% | 4.0% |
| Maximum | 83.1% | 18.7% |
| Range | 74.7% | 14.7% |
| Mean | 28.0% | 10.4% |
| Median | 15.9% | 10.1% |
| Interquartile 25% (IQ1) | 10.1% | 9.4% |
| Interquartile 75% (IQ3) | 50.0% | 11.3% |
| Interquartile Range (IQR) | 39.9% | 1.9% |
| Standard Deviation (Sample) | 22.6% | 2.2% |
| Standard Deviation (Population) | 22.1% | 2.2% |
Similar Demographics by Unemployment Among Ages 20 to 24 years
Demographics Similar to Scandinavians by Unemployment Among Ages 20 to 24 years
In terms of unemployment among ages 20 to 24 years, the demographic groups most similar to Scandinavians are Immigrants from North Macedonia (9.5%, a difference of 0.010%), Immigrants from Afghanistan (9.5%, a difference of 0.020%), Immigrants from Eastern Africa (9.5%, a difference of 0.090%), Immigrants from Zimbabwe (9.5%, a difference of 0.11%), and Cambodian (9.5%, a difference of 0.13%).
| Demographics | Rating | Rank | Unemployment Among Ages 20 to 24 years |
| Immigrants | Nepal | 100.0 /100 | #23 | Exceptional 9.4% |
| Taiwanese | 100.0 /100 | #24 | Exceptional 9.4% |
| Immigrants | Eritrea | 100.0 /100 | #25 | Exceptional 9.5% |
| Swedes | 100.0 /100 | #26 | Exceptional 9.5% |
| Immigrants | Zimbabwe | 100.0 /100 | #27 | Exceptional 9.5% |
| Immigrants | Afghanistan | 100.0 /100 | #28 | Exceptional 9.5% |
| Immigrants | North Macedonia | 100.0 /100 | #29 | Exceptional 9.5% |
| Scandinavians | 100.0 /100 | #30 | Exceptional 9.5% |
| Immigrants | Eastern Africa | 100.0 /100 | #31 | Exceptional 9.5% |
| Cambodians | 100.0 /100 | #32 | Exceptional 9.5% |
| Australians | 100.0 /100 | #33 | Exceptional 9.6% |
| Yugoslavians | 100.0 /100 | #34 | Exceptional 9.6% |
| Germans | 100.0 /100 | #35 | Exceptional 9.6% |
| Belgians | 100.0 /100 | #36 | Exceptional 9.6% |
| Immigrants | Zaire | 100.0 /100 | #37 | Exceptional 9.6% |
Demographics Similar to Immigrants from Asia by Unemployment Among Ages 20 to 24 years
In terms of unemployment among ages 20 to 24 years, the demographic groups most similar to Immigrants from Asia are Estonian (10.3%, a difference of 0.010%), Indian (Asian) (10.3%, a difference of 0.050%), Spaniard (10.3%, a difference of 0.080%), Immigrants from Korea (10.3%, a difference of 0.090%), and Immigrants from England (10.3%, a difference of 0.10%).
| Demographics | Rating | Rank | Unemployment Among Ages 20 to 24 years |
| Lithuanians | 70.0 /100 | #155 | Good 10.2% |
| Canadians | 66.7 /100 | #156 | Good 10.2% |
| Immigrants | Uganda | 65.6 /100 | #157 | Good 10.2% |
| Immigrants | Kazakhstan | 65.5 /100 | #158 | Good 10.2% |
| Immigrants | England | 63.7 /100 | #159 | Good 10.3% |
| Spaniards | 63.4 /100 | #160 | Good 10.3% |
| Indians (Asian) | 62.6 /100 | #161 | Good 10.3% |
| Immigrants | Asia | 61.3 /100 | #162 | Good 10.3% |
| Estonians | 61.1 /100 | #163 | Good 10.3% |
| Immigrants | Korea | 59.0 /100 | #164 | Average 10.3% |
| Lebanese | 58.3 /100 | #165 | Average 10.3% |
| Italians | 57.7 /100 | #166 | Average 10.3% |
| Immigrants | Fiji | 57.6 /100 | #167 | Average 10.3% |
| Iraqis | 56.7 /100 | #168 | Average 10.3% |
| Immigrants | Colombia | 56.3 /100 | #169 | Average 10.3% |