Immigrants from Belarus vs Danish Unemployment Among Ages 35 to 44 years
COMPARE
Immigrants from Belarus
Danish
Unemployment Among Ages 35 to 44 years
Unemployment Among Ages 35 to 44 years Comparison
Immigrants from Belarus
Danes
4.6%
UNEMPLOYMENT AMONG AGES 35 TO 44 YEARS
63.4/ 100
METRIC RATING
157th/ 347
METRIC RANK
4.1%
UNEMPLOYMENT AMONG AGES 35 TO 44 YEARS
99.9/ 100
METRIC RATING
9th/ 347
METRIC RANK
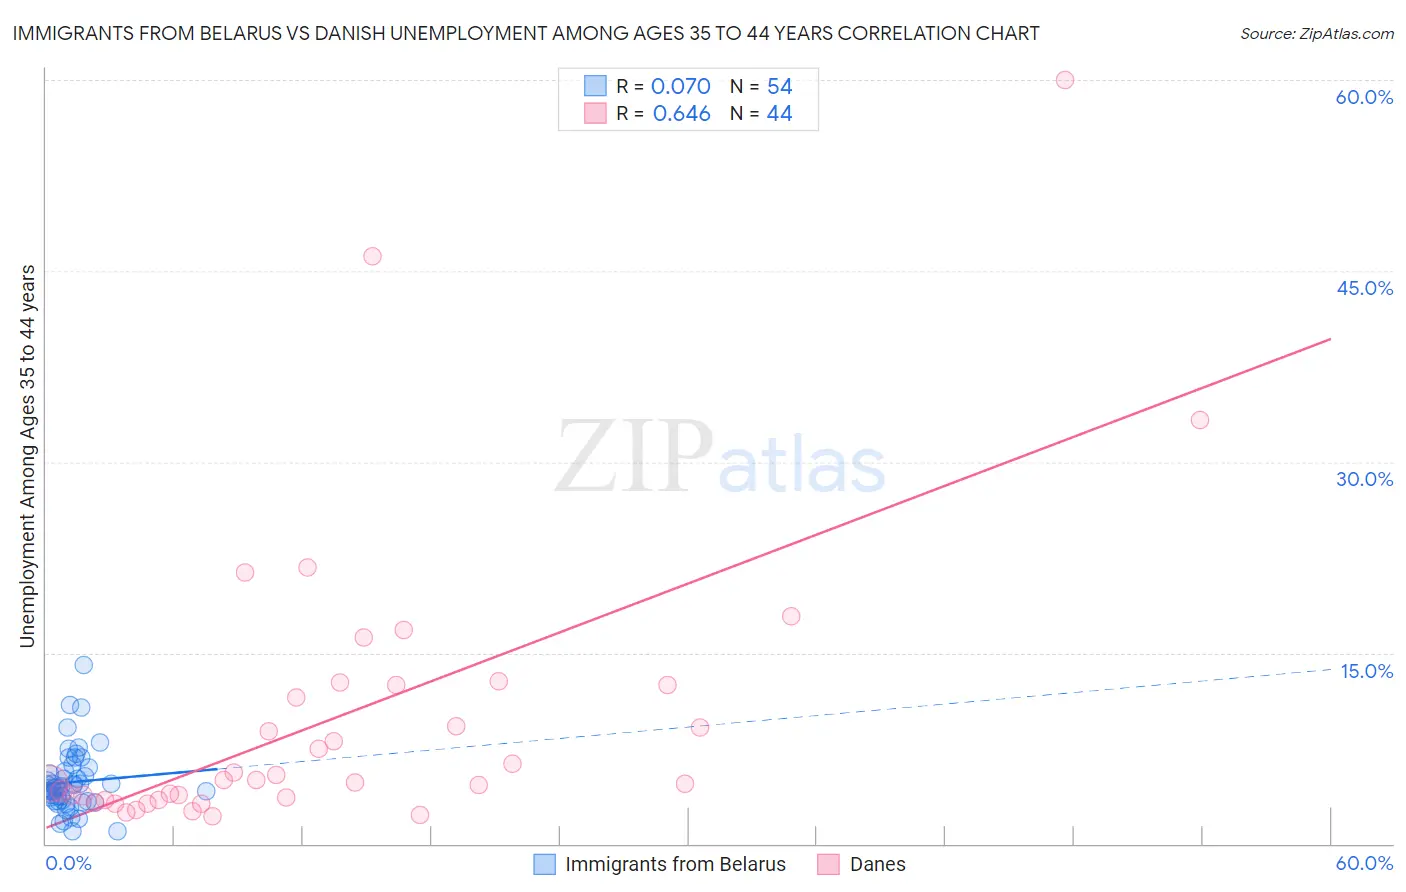
Immigrants from Belarus vs Danish Unemployment Among Ages 35 to 44 years Correlation Chart
The statistical analysis conducted on geographies consisting of 149,108,427 people shows a slight positive correlation between the proportion of Immigrants from Belarus and unemployment rate among population between the ages 35 and 44 in the United States with a correlation coefficient (R) of 0.070 and weighted average of 4.6%. Similarly, the statistical analysis conducted on geographies consisting of 452,726,359 people shows a significant positive correlation between the proportion of Danes and unemployment rate among population between the ages 35 and 44 in the United States with a correlation coefficient (R) of 0.646 and weighted average of 4.1%, a difference of 13.1%.
Unemployment Among Ages 35 to 44 years Correlation Summary
| Measurement | Immigrants from Belarus | Danish |
| Minimum | 1.0% | 2.1% |
| Maximum | 14.0% | 60.0% |
| Range | 13.0% | 57.9% |
| Mean | 4.8% | 10.0% |
| Median | 4.4% | 5.0% |
| Interquartile 25% (IQ1) | 3.3% | 3.5% |
| Interquartile 75% (IQ3) | 5.7% | 12.5% |
| Interquartile Range (IQR) | 2.3% | 9.0% |
| Standard Deviation (Sample) | 2.5% | 11.6% |
| Standard Deviation (Population) | 2.4% | 11.5% |
Similar Demographics by Unemployment Among Ages 35 to 44 years
Demographics Similar to Immigrants from Belarus by Unemployment Among Ages 35 to 44 years
In terms of unemployment among ages 35 to 44 years, the demographic groups most similar to Immigrants from Belarus are South American (4.6%, a difference of 0.020%), Immigrants from Iran (4.6%, a difference of 0.020%), Albanian (4.6%, a difference of 0.030%), Hungarian (4.6%, a difference of 0.070%), and White/Caucasian (4.6%, a difference of 0.11%).
| Demographics | Rating | Rank | Unemployment Among Ages 35 to 44 years |
| Immigrants | England | 70.5 /100 | #150 | Good 4.6% |
| Puget Sound Salish | 67.1 /100 | #151 | Good 4.6% |
| Pakistanis | 67.1 /100 | #152 | Good 4.6% |
| Immigrants | Brazil | 67.0 /100 | #153 | Good 4.6% |
| Immigrants | Western Europe | 65.5 /100 | #154 | Good 4.6% |
| Whites/Caucasians | 64.9 /100 | #155 | Good 4.6% |
| South Americans | 63.7 /100 | #156 | Good 4.6% |
| Immigrants | Belarus | 63.4 /100 | #157 | Good 4.6% |
| Immigrants | Iran | 63.1 /100 | #158 | Good 4.6% |
| Albanians | 63.0 /100 | #159 | Good 4.6% |
| Hungarians | 62.6 /100 | #160 | Good 4.6% |
| Celtics | 61.7 /100 | #161 | Good 4.7% |
| Costa Ricans | 59.6 /100 | #162 | Average 4.7% |
| South Africans | 58.5 /100 | #163 | Average 4.7% |
| Immigrants | Morocco | 57.2 /100 | #164 | Average 4.7% |
Demographics Similar to Danes by Unemployment Among Ages 35 to 44 years
In terms of unemployment among ages 35 to 44 years, the demographic groups most similar to Danes are Immigrants from South Central Asia (4.1%, a difference of 0.080%), Immigrants from Cuba (4.1%, a difference of 0.65%), Immigrants from Singapore (4.1%, a difference of 0.66%), Sudanese (4.1%, a difference of 0.72%), and Venezuelan (4.1%, a difference of 0.82%).
| Demographics | Rating | Rank | Unemployment Among Ages 35 to 44 years |
| Thais | 100.0 /100 | #2 | Exceptional 3.9% |
| Norwegians | 100.0 /100 | #3 | Exceptional 4.0% |
| Immigrants | Taiwan | 100.0 /100 | #4 | Exceptional 4.0% |
| Filipinos | 100.0 /100 | #5 | Exceptional 4.0% |
| Immigrants | Venezuela | 100.0 /100 | #6 | Exceptional 4.0% |
| Immigrants | Cuba | 99.9 /100 | #7 | Exceptional 4.1% |
| Immigrants | South Central Asia | 99.9 /100 | #8 | Exceptional 4.1% |
| Danes | 99.9 /100 | #9 | Exceptional 4.1% |
| Immigrants | Singapore | 99.9 /100 | #10 | Exceptional 4.1% |
| Sudanese | 99.9 /100 | #11 | Exceptional 4.1% |
| Venezuelans | 99.9 /100 | #12 | Exceptional 4.1% |
| Bolivians | 99.9 /100 | #13 | Exceptional 4.1% |
| Czechs | 99.9 /100 | #14 | Exceptional 4.1% |
| Tongans | 99.8 /100 | #15 | Exceptional 4.2% |
| Cubans | 99.8 /100 | #16 | Exceptional 4.2% |