Immigrants from Trinidad and Tobago vs Danish Unemployment Among Ages 35 to 44 years
COMPARE
Immigrants from Trinidad and Tobago
Danish
Unemployment Among Ages 35 to 44 years
Unemployment Among Ages 35 to 44 years Comparison
Immigrants from Trinidad and Tobago
Danes
5.6%
UNEMPLOYMENT AMONG AGES 35 TO 44 YEARS
0.0/ 100
METRIC RATING
296th/ 347
METRIC RANK
4.1%
UNEMPLOYMENT AMONG AGES 35 TO 44 YEARS
99.9/ 100
METRIC RATING
9th/ 347
METRIC RANK
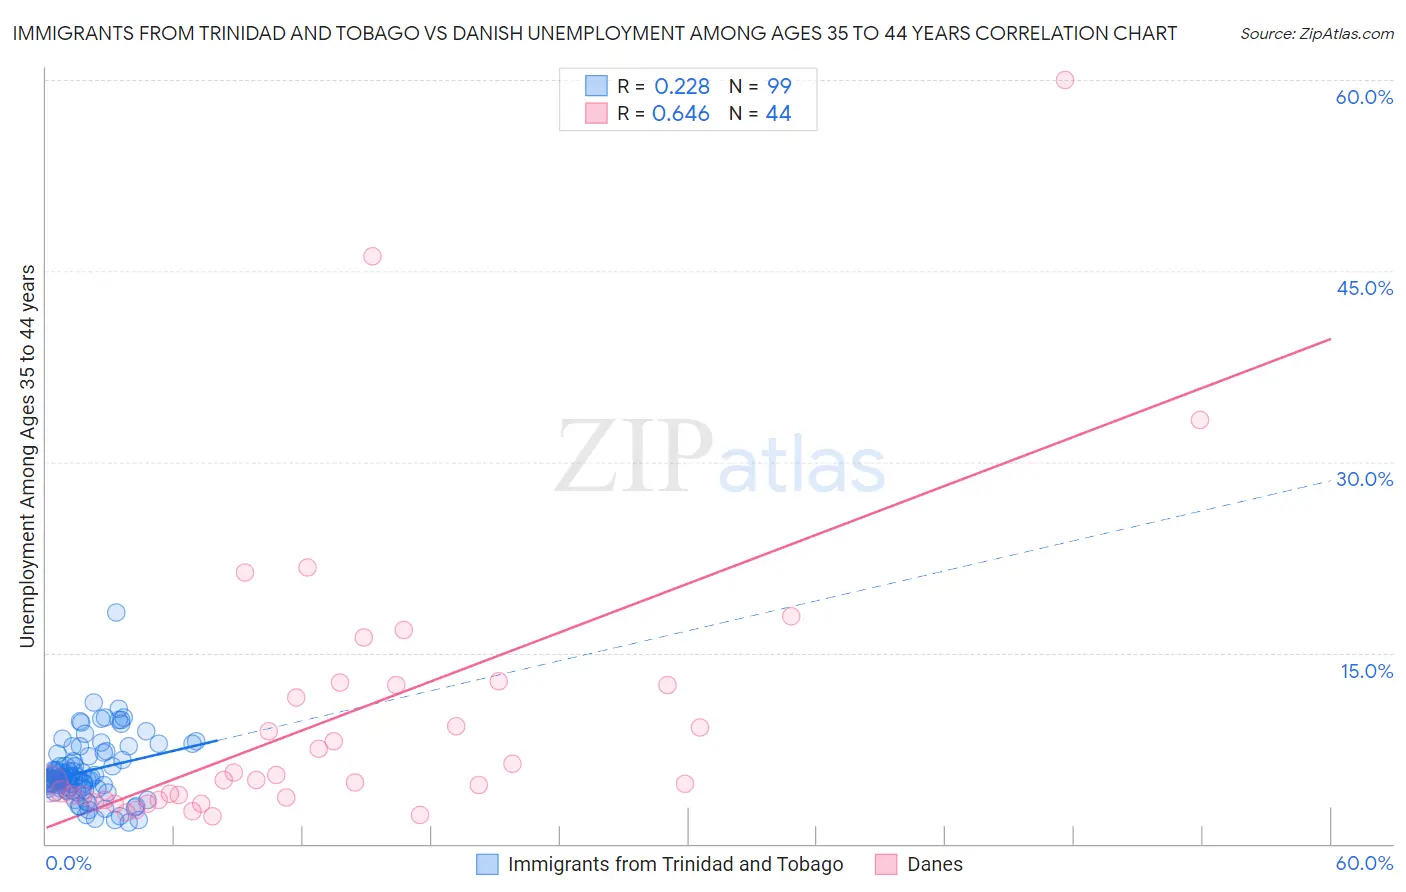
Immigrants from Trinidad and Tobago vs Danish Unemployment Among Ages 35 to 44 years Correlation Chart
The statistical analysis conducted on geographies consisting of 221,225,098 people shows a weak positive correlation between the proportion of Immigrants from Trinidad and Tobago and unemployment rate among population between the ages 35 and 44 in the United States with a correlation coefficient (R) of 0.228 and weighted average of 5.6%. Similarly, the statistical analysis conducted on geographies consisting of 452,726,359 people shows a significant positive correlation between the proportion of Danes and unemployment rate among population between the ages 35 and 44 in the United States with a correlation coefficient (R) of 0.646 and weighted average of 4.1%, a difference of 35.7%.
Unemployment Among Ages 35 to 44 years Correlation Summary
| Measurement | Immigrants from Trinidad and Tobago | Danish |
| Minimum | 1.7% | 2.1% |
| Maximum | 18.2% | 60.0% |
| Range | 16.5% | 57.9% |
| Mean | 5.7% | 10.0% |
| Median | 5.1% | 5.0% |
| Interquartile 25% (IQ1) | 4.3% | 3.5% |
| Interquartile 75% (IQ3) | 6.9% | 12.5% |
| Interquartile Range (IQR) | 2.6% | 9.0% |
| Standard Deviation (Sample) | 2.5% | 11.6% |
| Standard Deviation (Population) | 2.5% | 11.5% |
Similar Demographics by Unemployment Among Ages 35 to 44 years
Demographics Similar to Immigrants from Trinidad and Tobago by Unemployment Among Ages 35 to 44 years
In terms of unemployment among ages 35 to 44 years, the demographic groups most similar to Immigrants from Trinidad and Tobago are Ottawa (5.6%, a difference of 0.020%), U.S. Virgin Islander (5.6%, a difference of 0.11%), Aleut (5.6%, a difference of 0.12%), Immigrants from Jamaica (5.6%, a difference of 0.22%), and Trinidadian and Tobagonian (5.6%, a difference of 0.23%).
| Demographics | Rating | Rank | Unemployment Among Ages 35 to 44 years |
| Spanish American Indians | 0.0 /100 | #289 | Tragic 5.5% |
| Jamaicans | 0.0 /100 | #290 | Tragic 5.5% |
| Dutch West Indians | 0.0 /100 | #291 | Tragic 5.5% |
| Immigrants | Haiti | 0.0 /100 | #292 | Tragic 5.5% |
| Central American Indians | 0.0 /100 | #293 | Tragic 5.6% |
| Trinidadians and Tobagonians | 0.0 /100 | #294 | Tragic 5.6% |
| Ottawa | 0.0 /100 | #295 | Tragic 5.6% |
| Immigrants | Trinidad and Tobago | 0.0 /100 | #296 | Tragic 5.6% |
| U.S. Virgin Islanders | 0.0 /100 | #297 | Tragic 5.6% |
| Aleuts | 0.0 /100 | #298 | Tragic 5.6% |
| Immigrants | Jamaica | 0.0 /100 | #299 | Tragic 5.6% |
| Immigrants | West Indies | 0.0 /100 | #300 | Tragic 5.6% |
| Africans | 0.0 /100 | #301 | Tragic 5.6% |
| Nepalese | 0.0 /100 | #302 | Tragic 5.6% |
| Yakama | 0.0 /100 | #303 | Tragic 5.6% |
Demographics Similar to Danes by Unemployment Among Ages 35 to 44 years
In terms of unemployment among ages 35 to 44 years, the demographic groups most similar to Danes are Immigrants from South Central Asia (4.1%, a difference of 0.080%), Immigrants from Cuba (4.1%, a difference of 0.65%), Immigrants from Singapore (4.1%, a difference of 0.66%), Sudanese (4.1%, a difference of 0.72%), and Venezuelan (4.1%, a difference of 0.82%).
| Demographics | Rating | Rank | Unemployment Among Ages 35 to 44 years |
| Thais | 100.0 /100 | #2 | Exceptional 3.9% |
| Norwegians | 100.0 /100 | #3 | Exceptional 4.0% |
| Immigrants | Taiwan | 100.0 /100 | #4 | Exceptional 4.0% |
| Filipinos | 100.0 /100 | #5 | Exceptional 4.0% |
| Immigrants | Venezuela | 100.0 /100 | #6 | Exceptional 4.0% |
| Immigrants | Cuba | 99.9 /100 | #7 | Exceptional 4.1% |
| Immigrants | South Central Asia | 99.9 /100 | #8 | Exceptional 4.1% |
| Danes | 99.9 /100 | #9 | Exceptional 4.1% |
| Immigrants | Singapore | 99.9 /100 | #10 | Exceptional 4.1% |
| Sudanese | 99.9 /100 | #11 | Exceptional 4.1% |
| Venezuelans | 99.9 /100 | #12 | Exceptional 4.1% |
| Bolivians | 99.9 /100 | #13 | Exceptional 4.1% |
| Czechs | 99.9 /100 | #14 | Exceptional 4.1% |
| Tongans | 99.8 /100 | #15 | Exceptional 4.2% |
| Cubans | 99.8 /100 | #16 | Exceptional 4.2% |