Salvadoran vs Immigrants from Somalia Unemployment Among Ages 35 to 44 years
COMPARE
Salvadoran
Immigrants from Somalia
Unemployment Among Ages 35 to 44 years
Unemployment Among Ages 35 to 44 years Comparison
Salvadorans
Immigrants from Somalia
5.1%
UNEMPLOYMENT AMONG AGES 35 TO 44 YEARS
0.4/ 100
METRIC RATING
243rd/ 347
METRIC RANK
5.2%
UNEMPLOYMENT AMONG AGES 35 TO 44 YEARS
0.3/ 100
METRIC RATING
247th/ 347
METRIC RANK
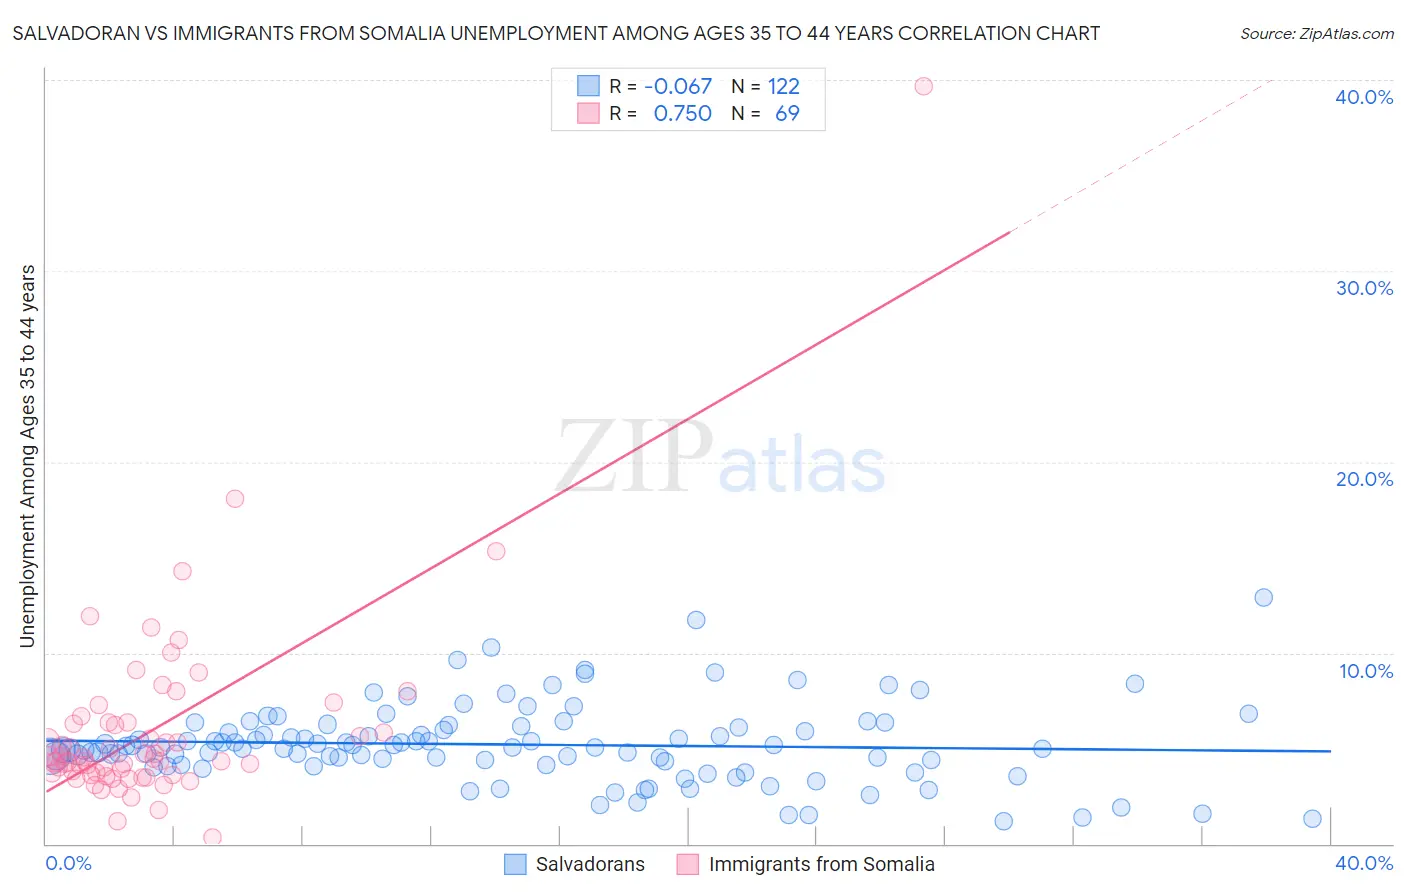
Salvadoran vs Immigrants from Somalia Unemployment Among Ages 35 to 44 years Correlation Chart
The statistical analysis conducted on geographies consisting of 391,087,109 people shows a slight negative correlation between the proportion of Salvadorans and unemployment rate among population between the ages 35 and 44 in the United States with a correlation coefficient (R) of -0.067 and weighted average of 5.1%. Similarly, the statistical analysis conducted on geographies consisting of 91,792,847 people shows a strong positive correlation between the proportion of Immigrants from Somalia and unemployment rate among population between the ages 35 and 44 in the United States with a correlation coefficient (R) of 0.750 and weighted average of 5.2%, a difference of 0.42%.
Unemployment Among Ages 35 to 44 years Correlation Summary
| Measurement | Salvadoran | Immigrants from Somalia |
| Minimum | 1.2% | 0.30% |
| Maximum | 12.9% | 39.7% |
| Range | 11.7% | 39.4% |
| Mean | 5.2% | 6.0% |
| Median | 5.1% | 4.4% |
| Interquartile 25% (IQ1) | 4.2% | 3.6% |
| Interquartile 75% (IQ3) | 6.1% | 6.3% |
| Interquartile Range (IQR) | 1.9% | 2.7% |
| Standard Deviation (Sample) | 2.0% | 5.2% |
| Standard Deviation (Population) | 2.0% | 5.2% |
Demographics Similar to Salvadorans and Immigrants from Somalia by Unemployment Among Ages 35 to 44 years
In terms of unemployment among ages 35 to 44 years, the demographic groups most similar to Salvadorans are Guatemalan (5.1%, a difference of 0.0%), Delaware (5.1%, a difference of 0.12%), Bahamian (5.2%, a difference of 0.26%), Immigrants from Guatemala (5.2%, a difference of 0.26%), and Immigrants from Honduras (5.1%, a difference of 0.49%). Similarly, the demographic groups most similar to Immigrants from Somalia are Bahamian (5.2%, a difference of 0.16%), Immigrants from Guatemala (5.2%, a difference of 0.16%), Guatemalan (5.1%, a difference of 0.42%), Alsatian (5.2%, a difference of 0.50%), and Immigrants from Liberia (5.2%, a difference of 0.53%).
| Demographics | Rating | Rank | Unemployment Among Ages 35 to 44 years |
| Guamanians/Chamorros | 0.9 /100 | #235 | Tragic 5.1% |
| Central Americans | 0.8 /100 | #236 | Tragic 5.1% |
| Kiowa | 0.8 /100 | #237 | Tragic 5.1% |
| Hondurans | 0.7 /100 | #238 | Tragic 5.1% |
| Nigerians | 0.7 /100 | #239 | Tragic 5.1% |
| Somalis | 0.7 /100 | #240 | Tragic 5.1% |
| Immigrants | Honduras | 0.6 /100 | #241 | Tragic 5.1% |
| Delaware | 0.5 /100 | #242 | Tragic 5.1% |
| Salvadorans | 0.4 /100 | #243 | Tragic 5.1% |
| Guatemalans | 0.4 /100 | #244 | Tragic 5.1% |
| Bahamians | 0.4 /100 | #245 | Tragic 5.2% |
| Immigrants | Guatemala | 0.4 /100 | #246 | Tragic 5.2% |
| Immigrants | Somalia | 0.3 /100 | #247 | Tragic 5.2% |
| Alsatians | 0.2 /100 | #248 | Tragic 5.2% |
| Immigrants | Liberia | 0.2 /100 | #249 | Tragic 5.2% |
| Immigrants | El Salvador | 0.2 /100 | #250 | Tragic 5.2% |
| Comanche | 0.2 /100 | #251 | Tragic 5.2% |
| Armenians | 0.2 /100 | #252 | Tragic 5.2% |
| Mexican American Indians | 0.2 /100 | #253 | Tragic 5.2% |
| Immigrants | Bahamas | 0.2 /100 | #254 | Tragic 5.2% |
| Cherokee | 0.2 /100 | #255 | Tragic 5.2% |