Salvadoran vs Immigrants from Latin America Unemployment Among Ages 35 to 44 years
COMPARE
Salvadoran
Immigrants from Latin America
Unemployment Among Ages 35 to 44 years
Unemployment Among Ages 35 to 44 years Comparison
Salvadorans
Immigrants from Latin America
5.1%
UNEMPLOYMENT AMONG AGES 35 TO 44 YEARS
0.4/ 100
METRIC RATING
243rd/ 347
METRIC RANK
5.3%
UNEMPLOYMENT AMONG AGES 35 TO 44 YEARS
0.1/ 100
METRIC RATING
258th/ 347
METRIC RANK
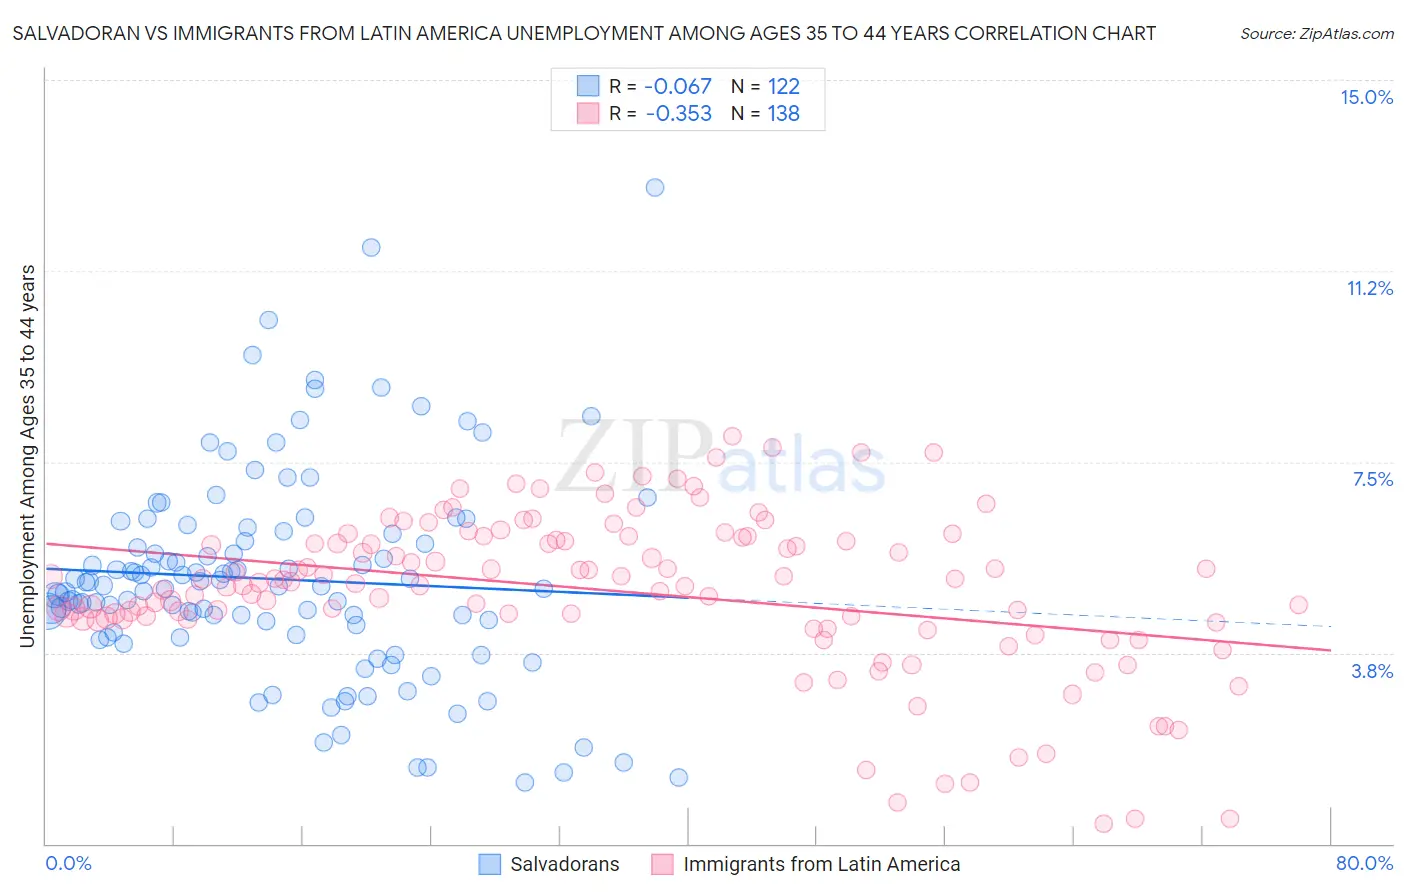
Salvadoran vs Immigrants from Latin America Unemployment Among Ages 35 to 44 years Correlation Chart
The statistical analysis conducted on geographies consisting of 391,087,109 people shows a slight negative correlation between the proportion of Salvadorans and unemployment rate among population between the ages 35 and 44 in the United States with a correlation coefficient (R) of -0.067 and weighted average of 5.1%. Similarly, the statistical analysis conducted on geographies consisting of 526,559,283 people shows a mild negative correlation between the proportion of Immigrants from Latin America and unemployment rate among population between the ages 35 and 44 in the United States with a correlation coefficient (R) of -0.353 and weighted average of 5.3%, a difference of 2.3%.
Unemployment Among Ages 35 to 44 years Correlation Summary
| Measurement | Salvadoran | Immigrants from Latin America |
| Minimum | 1.2% | 0.40% |
| Maximum | 12.9% | 8.0% |
| Range | 11.7% | 7.6% |
| Mean | 5.2% | 5.0% |
| Median | 5.1% | 5.1% |
| Interquartile 25% (IQ1) | 4.2% | 4.4% |
| Interquartile 75% (IQ3) | 6.1% | 6.0% |
| Interquartile Range (IQR) | 1.9% | 1.6% |
| Standard Deviation (Sample) | 2.0% | 1.6% |
| Standard Deviation (Population) | 2.0% | 1.6% |
Demographics Similar to Salvadorans and Immigrants from Latin America by Unemployment Among Ages 35 to 44 years
In terms of unemployment among ages 35 to 44 years, the demographic groups most similar to Salvadorans are Guatemalan (5.1%, a difference of 0.0%), Delaware (5.1%, a difference of 0.12%), Bahamian (5.2%, a difference of 0.26%), Immigrants from Guatemala (5.2%, a difference of 0.26%), and Immigrants from Somalia (5.2%, a difference of 0.42%). Similarly, the demographic groups most similar to Immigrants from Latin America are Mexican (5.3%, a difference of 0.090%), Immigrants from Fiji (5.3%, a difference of 0.12%), Subsaharan African (5.3%, a difference of 0.13%), Seminole (5.2%, a difference of 0.41%), and Cherokee (5.2%, a difference of 0.66%).
| Demographics | Rating | Rank | Unemployment Among Ages 35 to 44 years |
| Somalis | 0.7 /100 | #240 | Tragic 5.1% |
| Immigrants | Honduras | 0.6 /100 | #241 | Tragic 5.1% |
| Delaware | 0.5 /100 | #242 | Tragic 5.1% |
| Salvadorans | 0.4 /100 | #243 | Tragic 5.1% |
| Guatemalans | 0.4 /100 | #244 | Tragic 5.1% |
| Bahamians | 0.4 /100 | #245 | Tragic 5.2% |
| Immigrants | Guatemala | 0.4 /100 | #246 | Tragic 5.2% |
| Immigrants | Somalia | 0.3 /100 | #247 | Tragic 5.2% |
| Alsatians | 0.2 /100 | #248 | Tragic 5.2% |
| Immigrants | Liberia | 0.2 /100 | #249 | Tragic 5.2% |
| Immigrants | El Salvador | 0.2 /100 | #250 | Tragic 5.2% |
| Comanche | 0.2 /100 | #251 | Tragic 5.2% |
| Armenians | 0.2 /100 | #252 | Tragic 5.2% |
| Mexican American Indians | 0.2 /100 | #253 | Tragic 5.2% |
| Immigrants | Bahamas | 0.2 /100 | #254 | Tragic 5.2% |
| Cherokee | 0.2 /100 | #255 | Tragic 5.2% |
| Seminole | 0.1 /100 | #256 | Tragic 5.2% |
| Immigrants | Fiji | 0.1 /100 | #257 | Tragic 5.3% |
| Immigrants | Latin America | 0.1 /100 | #258 | Tragic 5.3% |
| Mexicans | 0.1 /100 | #259 | Tragic 5.3% |
| Sub-Saharan Africans | 0.1 /100 | #260 | Tragic 5.3% |