Immigrants from Ethiopia vs Immigrants from Latin America Unemployment Among Ages 35 to 44 years
COMPARE
Immigrants from Ethiopia
Immigrants from Latin America
Unemployment Among Ages 35 to 44 years
Unemployment Among Ages 35 to 44 years Comparison
Immigrants from Ethiopia
Immigrants from Latin America
4.5%
UNEMPLOYMENT AMONG AGES 35 TO 44 YEARS
84.7/ 100
METRIC RATING
127th/ 347
METRIC RANK
5.3%
UNEMPLOYMENT AMONG AGES 35 TO 44 YEARS
0.1/ 100
METRIC RATING
258th/ 347
METRIC RANK
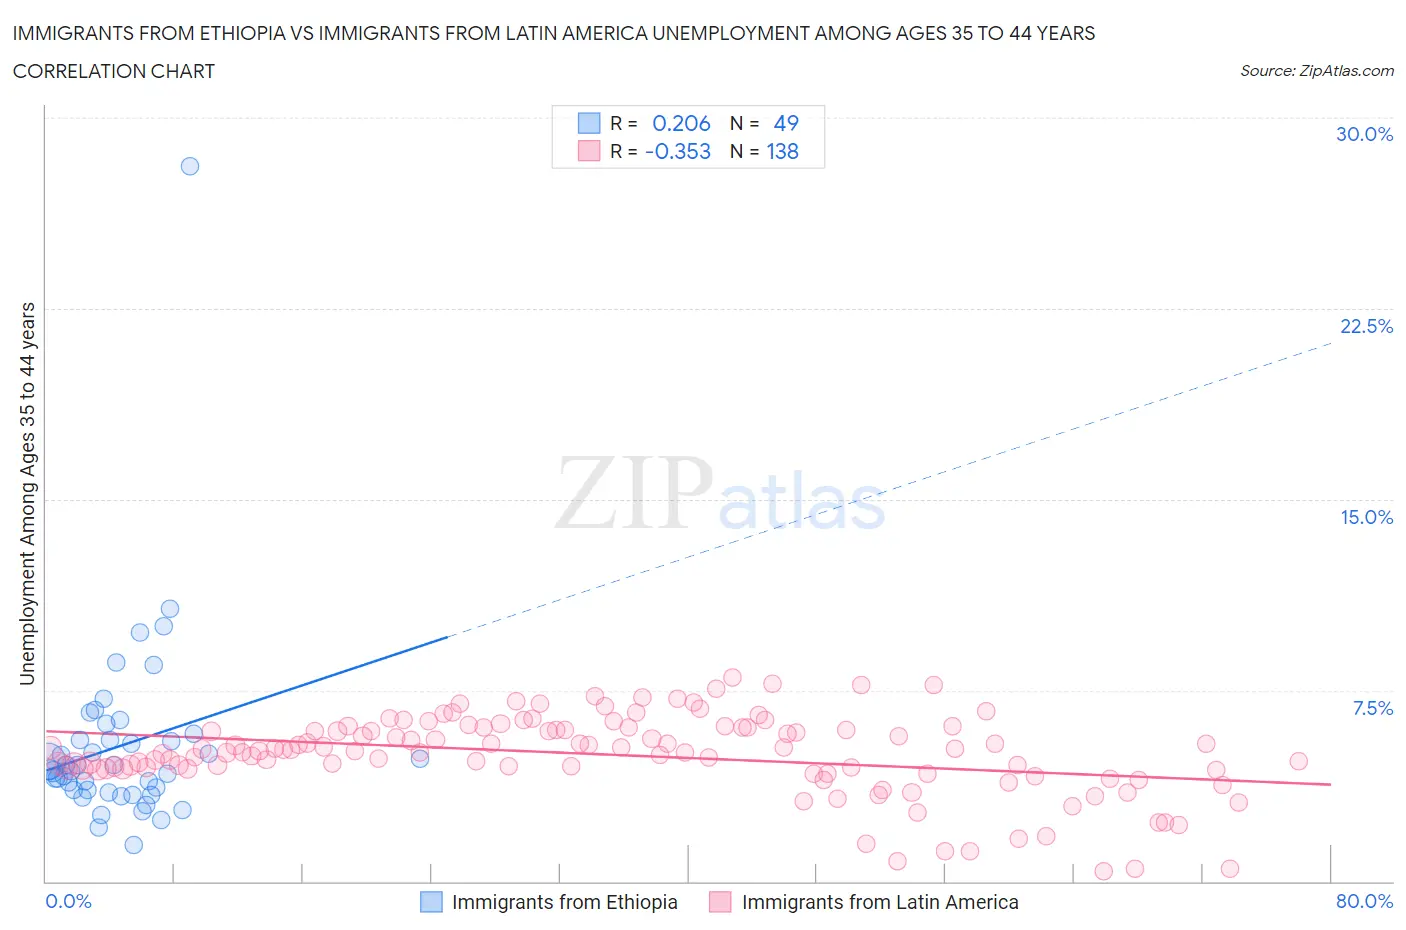
Immigrants from Ethiopia vs Immigrants from Latin America Unemployment Among Ages 35 to 44 years Correlation Chart
The statistical analysis conducted on geographies consisting of 209,718,778 people shows a weak positive correlation between the proportion of Immigrants from Ethiopia and unemployment rate among population between the ages 35 and 44 in the United States with a correlation coefficient (R) of 0.206 and weighted average of 4.5%. Similarly, the statistical analysis conducted on geographies consisting of 526,559,283 people shows a mild negative correlation between the proportion of Immigrants from Latin America and unemployment rate among population between the ages 35 and 44 in the United States with a correlation coefficient (R) of -0.353 and weighted average of 5.3%, a difference of 15.7%.
Unemployment Among Ages 35 to 44 years Correlation Summary
| Measurement | Immigrants from Ethiopia | Immigrants from Latin America |
| Minimum | 1.4% | 0.40% |
| Maximum | 28.1% | 8.0% |
| Range | 26.7% | 7.6% |
| Mean | 5.3% | 5.0% |
| Median | 4.4% | 5.1% |
| Interquartile 25% (IQ1) | 3.5% | 4.4% |
| Interquartile 75% (IQ3) | 5.7% | 6.0% |
| Interquartile Range (IQR) | 2.1% | 1.6% |
| Standard Deviation (Sample) | 3.9% | 1.6% |
| Standard Deviation (Population) | 3.8% | 1.6% |
Similar Demographics by Unemployment Among Ages 35 to 44 years
Demographics Similar to Immigrants from Ethiopia by Unemployment Among Ages 35 to 44 years
In terms of unemployment among ages 35 to 44 years, the demographic groups most similar to Immigrants from Ethiopia are Immigrants from Austria (4.5%, a difference of 0.010%), Czechoslovakian (4.6%, a difference of 0.17%), Immigrants from Northern Africa (4.5%, a difference of 0.20%), Immigrants from Spain (4.5%, a difference of 0.21%), and Immigrants from Croatia (4.6%, a difference of 0.21%).
| Demographics | Rating | Rank | Unemployment Among Ages 35 to 44 years |
| Ethiopians | 87.1 /100 | #120 | Excellent 4.5% |
| Immigrants | South Africa | 86.8 /100 | #121 | Excellent 4.5% |
| Sri Lankans | 86.8 /100 | #122 | Excellent 4.5% |
| Basques | 86.3 /100 | #123 | Excellent 4.5% |
| Immigrants | Spain | 86.1 /100 | #124 | Excellent 4.5% |
| Immigrants | Northern Africa | 86.1 /100 | #125 | Excellent 4.5% |
| Immigrants | Austria | 84.7 /100 | #126 | Excellent 4.5% |
| Immigrants | Ethiopia | 84.7 /100 | #127 | Excellent 4.5% |
| Czechoslovakians | 83.4 /100 | #128 | Excellent 4.6% |
| Immigrants | Croatia | 83.1 /100 | #129 | Excellent 4.6% |
| Immigrants | Eritrea | 82.8 /100 | #130 | Excellent 4.6% |
| Immigrants | Colombia | 82.6 /100 | #131 | Excellent 4.6% |
| Colombians | 80.8 /100 | #132 | Excellent 4.6% |
| Syrians | 80.7 /100 | #133 | Excellent 4.6% |
| Laotians | 80.1 /100 | #134 | Excellent 4.6% |
Demographics Similar to Immigrants from Latin America by Unemployment Among Ages 35 to 44 years
In terms of unemployment among ages 35 to 44 years, the demographic groups most similar to Immigrants from Latin America are Mexican (5.3%, a difference of 0.090%), Immigrants from Fiji (5.3%, a difference of 0.12%), Subsaharan African (5.3%, a difference of 0.13%), Spanish American (5.3%, a difference of 0.33%), and Seminole (5.2%, a difference of 0.41%).
| Demographics | Rating | Rank | Unemployment Among Ages 35 to 44 years |
| Comanche | 0.2 /100 | #251 | Tragic 5.2% |
| Armenians | 0.2 /100 | #252 | Tragic 5.2% |
| Mexican American Indians | 0.2 /100 | #253 | Tragic 5.2% |
| Immigrants | Bahamas | 0.2 /100 | #254 | Tragic 5.2% |
| Cherokee | 0.2 /100 | #255 | Tragic 5.2% |
| Seminole | 0.1 /100 | #256 | Tragic 5.2% |
| Immigrants | Fiji | 0.1 /100 | #257 | Tragic 5.3% |
| Immigrants | Latin America | 0.1 /100 | #258 | Tragic 5.3% |
| Mexicans | 0.1 /100 | #259 | Tragic 5.3% |
| Sub-Saharan Africans | 0.1 /100 | #260 | Tragic 5.3% |
| Spanish Americans | 0.1 /100 | #261 | Tragic 5.3% |
| Immigrants | Central America | 0.1 /100 | #262 | Tragic 5.3% |
| Choctaw | 0.1 /100 | #263 | Tragic 5.3% |
| Ghanaians | 0.1 /100 | #264 | Tragic 5.3% |
| Yaqui | 0.1 /100 | #265 | Tragic 5.3% |