Immigrants from Jamaica vs Immigrants from Latin America Unemployment Among Ages 35 to 44 years
COMPARE
Immigrants from Jamaica
Immigrants from Latin America
Unemployment Among Ages 35 to 44 years
Unemployment Among Ages 35 to 44 years Comparison
Immigrants from Jamaica
Immigrants from Latin America
5.6%
UNEMPLOYMENT AMONG AGES 35 TO 44 YEARS
0.0/ 100
METRIC RATING
299th/ 347
METRIC RANK
5.3%
UNEMPLOYMENT AMONG AGES 35 TO 44 YEARS
0.1/ 100
METRIC RATING
258th/ 347
METRIC RANK
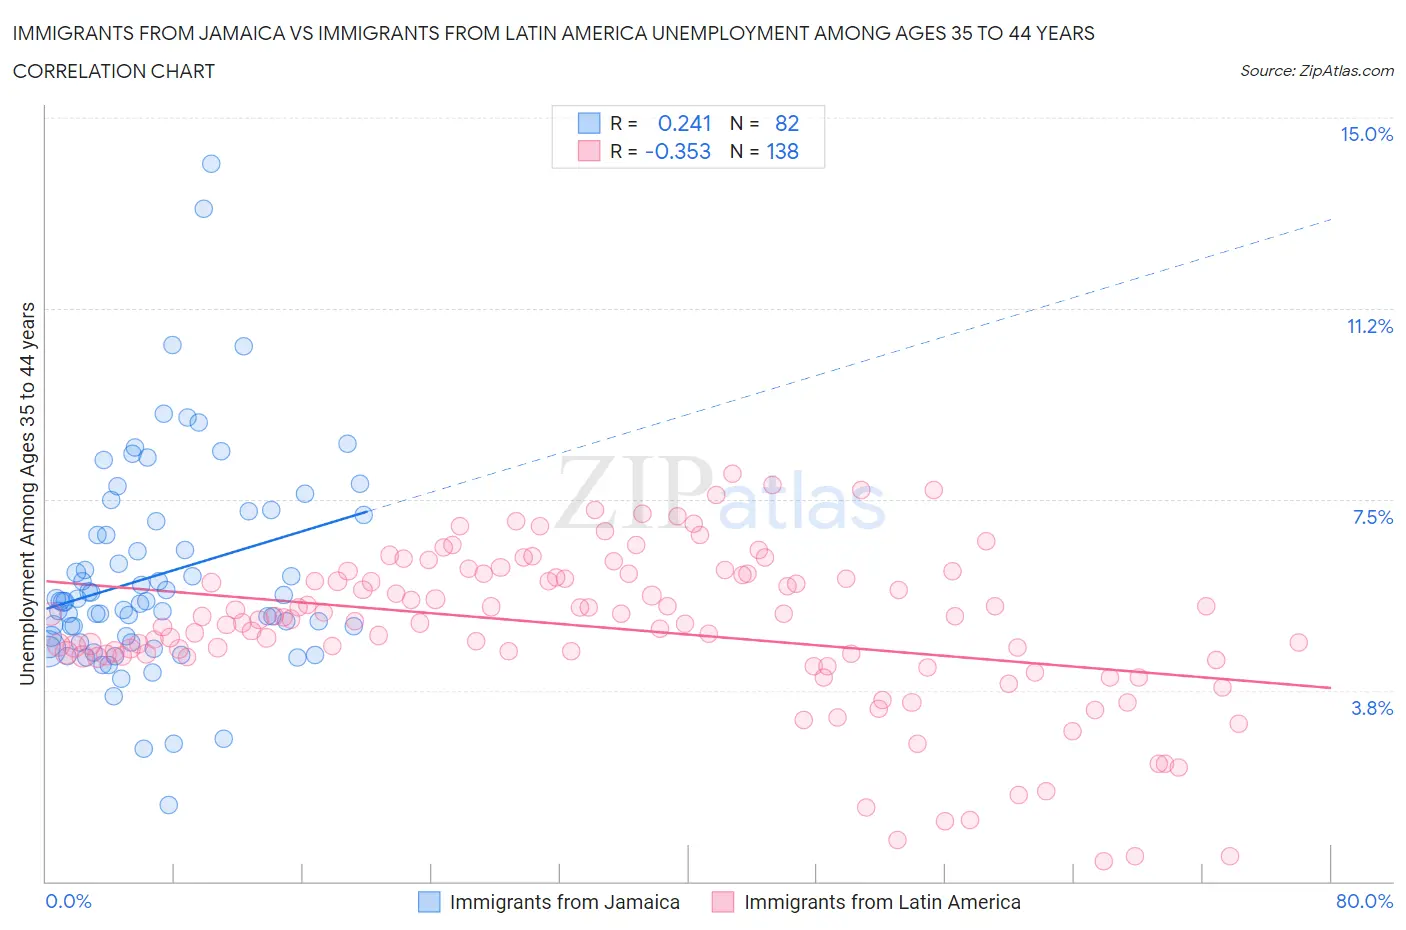
Immigrants from Jamaica vs Immigrants from Latin America Unemployment Among Ages 35 to 44 years Correlation Chart
The statistical analysis conducted on geographies consisting of 297,076,008 people shows a weak positive correlation between the proportion of Immigrants from Jamaica and unemployment rate among population between the ages 35 and 44 in the United States with a correlation coefficient (R) of 0.241 and weighted average of 5.6%. Similarly, the statistical analysis conducted on geographies consisting of 526,559,283 people shows a mild negative correlation between the proportion of Immigrants from Latin America and unemployment rate among population between the ages 35 and 44 in the United States with a correlation coefficient (R) of -0.353 and weighted average of 5.3%, a difference of 6.1%.
Unemployment Among Ages 35 to 44 years Correlation Summary
| Measurement | Immigrants from Jamaica | Immigrants from Latin America |
| Minimum | 1.5% | 0.40% |
| Maximum | 14.1% | 8.0% |
| Range | 12.6% | 7.6% |
| Mean | 6.0% | 5.0% |
| Median | 5.5% | 5.1% |
| Interquartile 25% (IQ1) | 4.7% | 4.4% |
| Interquartile 75% (IQ3) | 7.1% | 6.0% |
| Interquartile Range (IQR) | 2.4% | 1.6% |
| Standard Deviation (Sample) | 2.1% | 1.6% |
| Standard Deviation (Population) | 2.1% | 1.6% |
Similar Demographics by Unemployment Among Ages 35 to 44 years
Demographics Similar to Immigrants from Jamaica by Unemployment Among Ages 35 to 44 years
In terms of unemployment among ages 35 to 44 years, the demographic groups most similar to Immigrants from Jamaica are Immigrants from West Indies (5.6%, a difference of 0.050%), Aleut (5.6%, a difference of 0.10%), African (5.6%, a difference of 0.10%), U.S. Virgin Islander (5.6%, a difference of 0.11%), and Immigrants from Trinidad and Tobago (5.6%, a difference of 0.22%).
| Demographics | Rating | Rank | Unemployment Among Ages 35 to 44 years |
| Immigrants | Haiti | 0.0 /100 | #292 | Tragic 5.5% |
| Central American Indians | 0.0 /100 | #293 | Tragic 5.6% |
| Trinidadians and Tobagonians | 0.0 /100 | #294 | Tragic 5.6% |
| Ottawa | 0.0 /100 | #295 | Tragic 5.6% |
| Immigrants | Trinidad and Tobago | 0.0 /100 | #296 | Tragic 5.6% |
| U.S. Virgin Islanders | 0.0 /100 | #297 | Tragic 5.6% |
| Aleuts | 0.0 /100 | #298 | Tragic 5.6% |
| Immigrants | Jamaica | 0.0 /100 | #299 | Tragic 5.6% |
| Immigrants | West Indies | 0.0 /100 | #300 | Tragic 5.6% |
| Africans | 0.0 /100 | #301 | Tragic 5.6% |
| Nepalese | 0.0 /100 | #302 | Tragic 5.6% |
| Yakama | 0.0 /100 | #303 | Tragic 5.6% |
| West Indians | 0.0 /100 | #304 | Tragic 5.7% |
| Belizeans | 0.0 /100 | #305 | Tragic 5.7% |
| Barbadians | 0.0 /100 | #306 | Tragic 5.7% |
Demographics Similar to Immigrants from Latin America by Unemployment Among Ages 35 to 44 years
In terms of unemployment among ages 35 to 44 years, the demographic groups most similar to Immigrants from Latin America are Mexican (5.3%, a difference of 0.090%), Immigrants from Fiji (5.3%, a difference of 0.12%), Subsaharan African (5.3%, a difference of 0.13%), Spanish American (5.3%, a difference of 0.33%), and Seminole (5.2%, a difference of 0.41%).
| Demographics | Rating | Rank | Unemployment Among Ages 35 to 44 years |
| Comanche | 0.2 /100 | #251 | Tragic 5.2% |
| Armenians | 0.2 /100 | #252 | Tragic 5.2% |
| Mexican American Indians | 0.2 /100 | #253 | Tragic 5.2% |
| Immigrants | Bahamas | 0.2 /100 | #254 | Tragic 5.2% |
| Cherokee | 0.2 /100 | #255 | Tragic 5.2% |
| Seminole | 0.1 /100 | #256 | Tragic 5.2% |
| Immigrants | Fiji | 0.1 /100 | #257 | Tragic 5.3% |
| Immigrants | Latin America | 0.1 /100 | #258 | Tragic 5.3% |
| Mexicans | 0.1 /100 | #259 | Tragic 5.3% |
| Sub-Saharan Africans | 0.1 /100 | #260 | Tragic 5.3% |
| Spanish Americans | 0.1 /100 | #261 | Tragic 5.3% |
| Immigrants | Central America | 0.1 /100 | #262 | Tragic 5.3% |
| Choctaw | 0.1 /100 | #263 | Tragic 5.3% |
| Ghanaians | 0.1 /100 | #264 | Tragic 5.3% |
| Yaqui | 0.1 /100 | #265 | Tragic 5.3% |