Panamanian vs Immigrants from the Azores Unemployment Among Ages 25 to 29 years
COMPARE
Panamanian
Immigrants from the Azores
Unemployment Among Ages 25 to 29 years
Unemployment Among Ages 25 to 29 years Comparison
Panamanians
Immigrants from the Azores
7.0%
UNEMPLOYMENT AMONG AGES 25 TO 29 YEARS
2.1/ 100
METRIC RATING
235th/ 347
METRIC RANK
8.1%
UNEMPLOYMENT AMONG AGES 25 TO 29 YEARS
0.0/ 100
METRIC RATING
311th/ 347
METRIC RANK
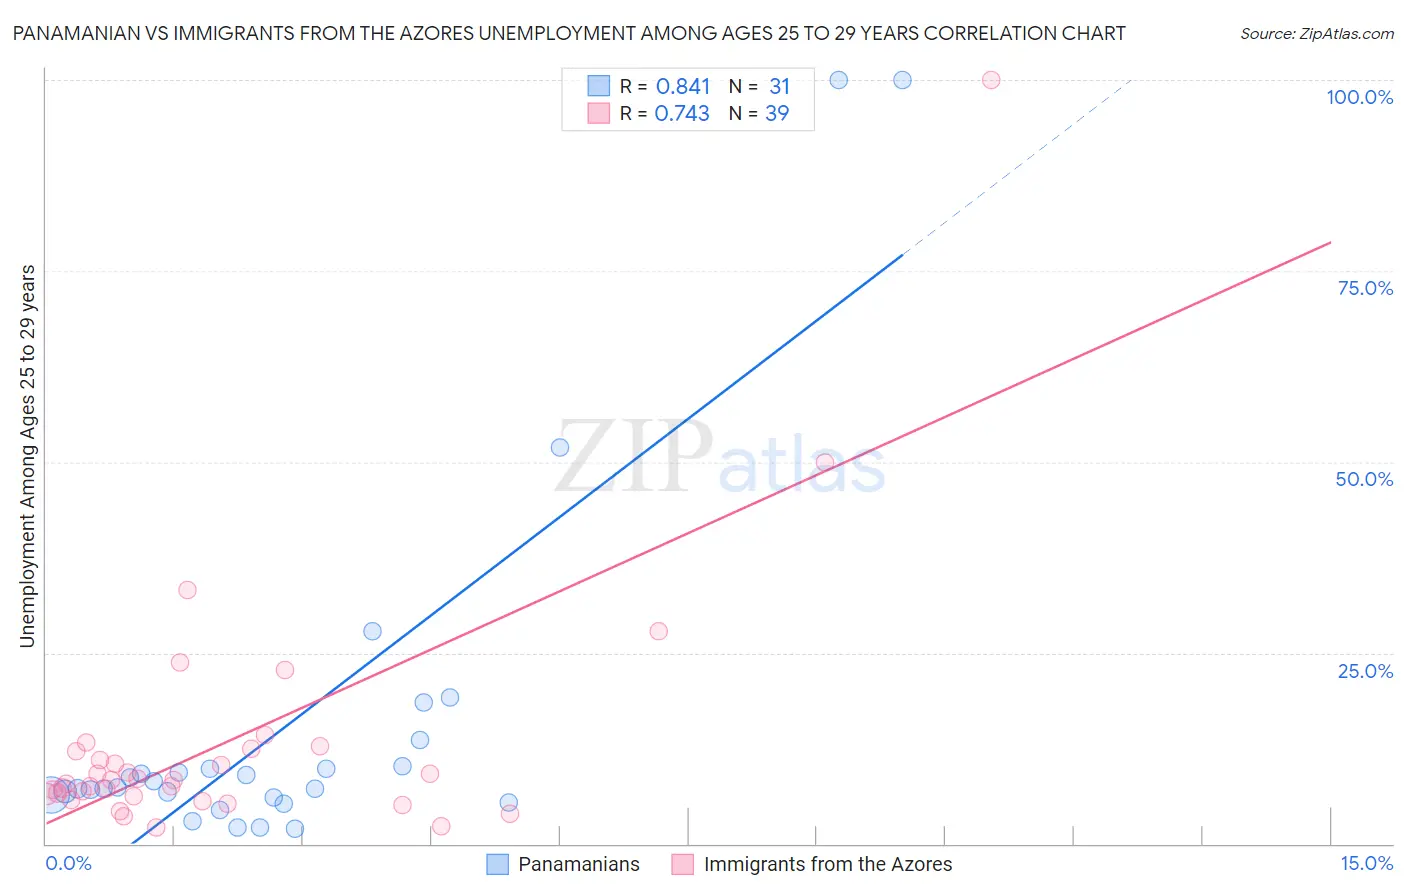
Panamanian vs Immigrants from the Azores Unemployment Among Ages 25 to 29 years Correlation Chart
The statistical analysis conducted on geographies consisting of 273,620,006 people shows a very strong positive correlation between the proportion of Panamanians and unemployment rate among population between the ages 25 and 29 in the United States with a correlation coefficient (R) of 0.841 and weighted average of 7.0%. Similarly, the statistical analysis conducted on geographies consisting of 45,622,335 people shows a strong positive correlation between the proportion of Immigrants from the Azores and unemployment rate among population between the ages 25 and 29 in the United States with a correlation coefficient (R) of 0.743 and weighted average of 8.1%, a difference of 15.1%.
Unemployment Among Ages 25 to 29 years Correlation Summary
| Measurement | Panamanian | Immigrants from the Azores |
| Minimum | 2.0% | 2.1% |
| Maximum | 100.0% | 100.0% |
| Range | 98.0% | 97.9% |
| Mean | 15.9% | 13.2% |
| Median | 7.4% | 8.4% |
| Interquartile 25% (IQ1) | 6.0% | 6.2% |
| Interquartile 75% (IQ3) | 10.1% | 12.5% |
| Interquartile Range (IQR) | 4.1% | 6.3% |
| Standard Deviation (Sample) | 24.3% | 17.0% |
| Standard Deviation (Population) | 24.0% | 16.8% |
Similar Demographics by Unemployment Among Ages 25 to 29 years
Demographics Similar to Panamanians by Unemployment Among Ages 25 to 29 years
In terms of unemployment among ages 25 to 29 years, the demographic groups most similar to Panamanians are Cape Verdean (7.0%, a difference of 0.14%), French Canadian (7.0%, a difference of 0.16%), Immigrants from Honduras (7.0%, a difference of 0.18%), Puget Sound Salish (7.1%, a difference of 0.21%), and Honduran (7.1%, a difference of 0.23%).
| Demographics | Rating | Rank | Unemployment Among Ages 25 to 29 years |
| Immigrants | Panama | 4.2 /100 | #228 | Tragic 7.0% |
| Bermudans | 3.8 /100 | #229 | Tragic 7.0% |
| Immigrants | El Salvador | 3.6 /100 | #230 | Tragic 7.0% |
| Central Americans | 3.0 /100 | #231 | Tragic 7.0% |
| Spanish Americans | 2.7 /100 | #232 | Tragic 7.0% |
| Immigrants | Honduras | 2.4 /100 | #233 | Tragic 7.0% |
| French Canadians | 2.4 /100 | #234 | Tragic 7.0% |
| Panamanians | 2.1 /100 | #235 | Tragic 7.0% |
| Cape Verdeans | 1.9 /100 | #236 | Tragic 7.0% |
| Puget Sound Salish | 1.8 /100 | #237 | Tragic 7.1% |
| Hondurans | 1.8 /100 | #238 | Tragic 7.1% |
| Potawatomi | 1.3 /100 | #239 | Tragic 7.1% |
| Native Hawaiians | 1.3 /100 | #240 | Tragic 7.1% |
| Immigrants | Sierra Leone | 1.3 /100 | #241 | Tragic 7.1% |
| Spanish American Indians | 1.1 /100 | #242 | Tragic 7.1% |
Demographics Similar to Immigrants from the Azores by Unemployment Among Ages 25 to 29 years
In terms of unemployment among ages 25 to 29 years, the demographic groups most similar to Immigrants from the Azores are U.S. Virgin Islander (8.1%, a difference of 0.24%), Immigrants from Haiti (8.1%, a difference of 0.25%), Immigrants from Jamaica (8.1%, a difference of 0.26%), Immigrants from Barbados (8.0%, a difference of 0.68%), and Haitian (8.0%, a difference of 0.85%).
| Demographics | Rating | Rank | Unemployment Among Ages 25 to 29 years |
| Cajuns | 0.0 /100 | #304 | Tragic 8.0% |
| Tsimshian | 0.0 /100 | #305 | Tragic 8.0% |
| Haitians | 0.0 /100 | #306 | Tragic 8.0% |
| Immigrants | Barbados | 0.0 /100 | #307 | Tragic 8.0% |
| Immigrants | Jamaica | 0.0 /100 | #308 | Tragic 8.1% |
| Immigrants | Haiti | 0.0 /100 | #309 | Tragic 8.1% |
| U.S. Virgin Islanders | 0.0 /100 | #310 | Tragic 8.1% |
| Immigrants | Azores | 0.0 /100 | #311 | Tragic 8.1% |
| Dutch West Indians | 0.0 /100 | #312 | Tragic 8.2% |
| Immigrants | St. Vincent and the Grenadines | 0.0 /100 | #313 | Tragic 8.4% |
| Immigrants | Dominica | 0.0 /100 | #314 | Tragic 8.4% |
| British West Indians | 0.0 /100 | #315 | Tragic 8.4% |
| Immigrants | Grenada | 0.0 /100 | #316 | Tragic 8.4% |
| Immigrants | Guyana | 0.0 /100 | #317 | Tragic 8.5% |
| Guyanese | 0.0 /100 | #318 | Tragic 8.5% |