Russian vs Nigerian Receiving Food Stamps
COMPARE
Russian
Nigerian
Receiving Food Stamps
Receiving Food Stamps Comparison
Russians
Nigerians
9.6%
RECEIVING FOOD STAMPS
99.4/ 100
METRIC RATING
48th/ 347
METRIC RANK
13.1%
RECEIVING FOOD STAMPS
3.5/ 100
METRIC RATING
227th/ 347
METRIC RANK
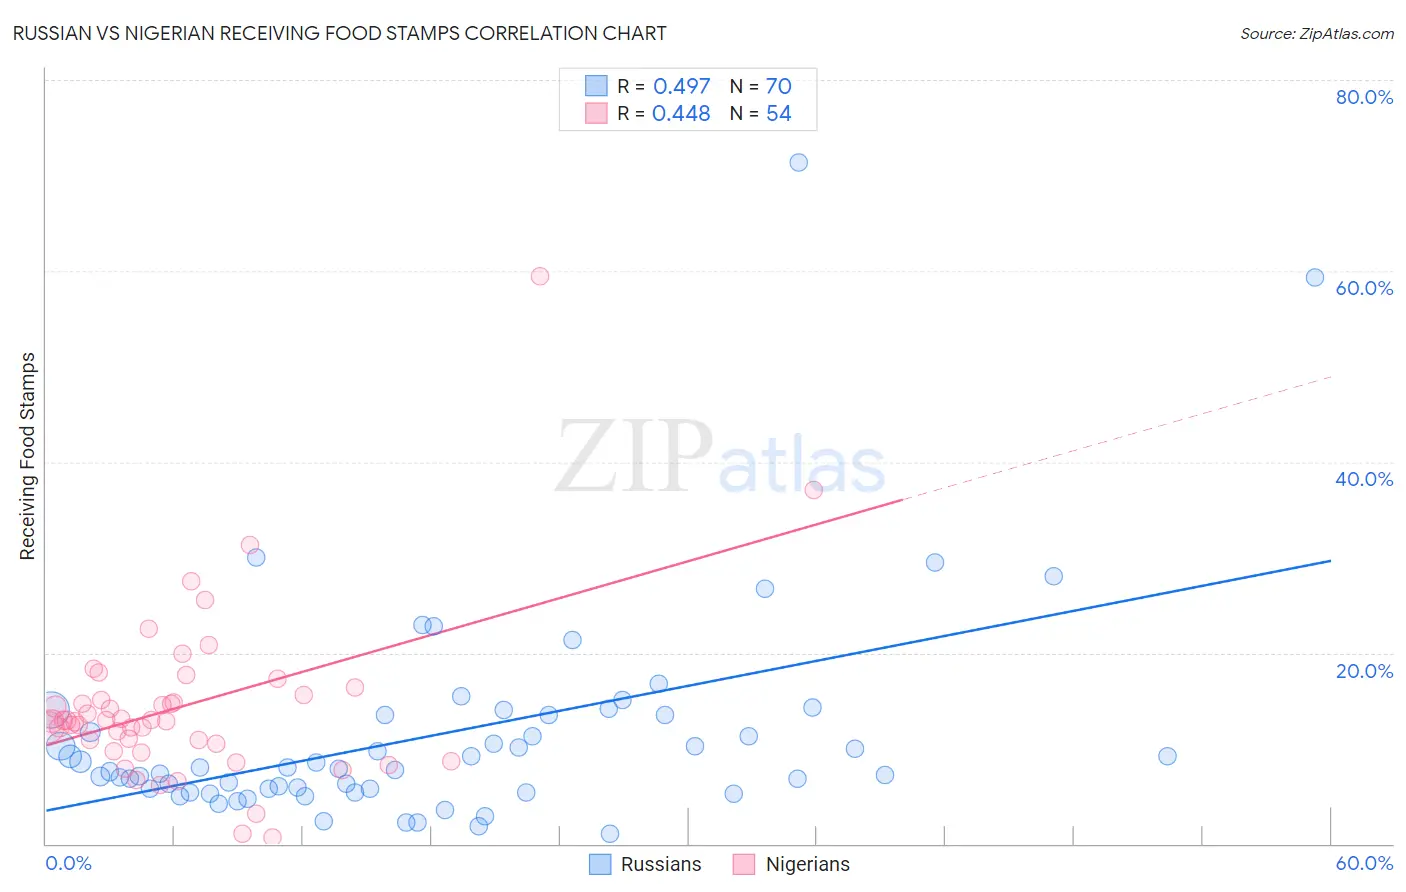
Russian vs Nigerian Receiving Food Stamps Correlation Chart
The statistical analysis conducted on geographies consisting of 509,493,528 people shows a moderate positive correlation between the proportion of Russians and percentage of population receiving government assistance and/or food stamps in the United States with a correlation coefficient (R) of 0.497 and weighted average of 9.6%. Similarly, the statistical analysis conducted on geographies consisting of 332,095,835 people shows a moderate positive correlation between the proportion of Nigerians and percentage of population receiving government assistance and/or food stamps in the United States with a correlation coefficient (R) of 0.448 and weighted average of 13.1%, a difference of 35.9%.
Receiving Food Stamps Correlation Summary
| Measurement | Russian | Nigerian |
| Minimum | 1.0% | 0.60% |
| Maximum | 71.4% | 59.5% |
| Range | 70.4% | 58.9% |
| Mean | 11.4% | 14.4% |
| Median | 7.9% | 12.9% |
| Interquartile 25% (IQ1) | 5.7% | 10.5% |
| Interquartile 75% (IQ3) | 13.5% | 15.6% |
| Interquartile Range (IQR) | 7.8% | 5.1% |
| Standard Deviation (Sample) | 11.4% | 9.1% |
| Standard Deviation (Population) | 11.3% | 9.0% |
Similar Demographics by Receiving Food Stamps
Demographics Similar to Russians by Receiving Food Stamps
In terms of receiving food stamps, the demographic groups most similar to Russians are Immigrants from Czechoslovakia (9.6%, a difference of 0.020%), Indian (Asian) (9.6%, a difference of 0.11%), Australian (9.6%, a difference of 0.17%), Immigrants from Belgium (9.6%, a difference of 0.25%), and Lithuanian (9.7%, a difference of 0.27%).
| Demographics | Rating | Rank | Receiving Food Stamps |
| Cambodians | 99.5 /100 | #41 | Exceptional 9.5% |
| Immigrants | China | 99.5 /100 | #42 | Exceptional 9.6% |
| Croatians | 99.5 /100 | #43 | Exceptional 9.6% |
| Immigrants | Denmark | 99.4 /100 | #44 | Exceptional 9.6% |
| Immigrants | Belgium | 99.4 /100 | #45 | Exceptional 9.6% |
| Australians | 99.4 /100 | #46 | Exceptional 9.6% |
| Indians (Asian) | 99.4 /100 | #47 | Exceptional 9.6% |
| Russians | 99.4 /100 | #48 | Exceptional 9.6% |
| Immigrants | Czechoslovakia | 99.4 /100 | #49 | Exceptional 9.6% |
| Lithuanians | 99.4 /100 | #50 | Exceptional 9.7% |
| Asians | 99.3 /100 | #51 | Exceptional 9.7% |
| Immigrants | South Africa | 99.3 /100 | #52 | Exceptional 9.7% |
| Tongans | 99.3 /100 | #53 | Exceptional 9.7% |
| Swiss | 99.3 /100 | #54 | Exceptional 9.7% |
| Immigrants | Switzerland | 99.3 /100 | #55 | Exceptional 9.7% |
Demographics Similar to Nigerians by Receiving Food Stamps
In terms of receiving food stamps, the demographic groups most similar to Nigerians are Panamanian (13.1%, a difference of 0.010%), Ottawa (13.1%, a difference of 0.020%), Chickasaw (13.1%, a difference of 0.050%), Puget Sound Salish (13.1%, a difference of 0.070%), and Immigrants from Nigeria (13.1%, a difference of 0.11%).
| Demographics | Rating | Rank | Receiving Food Stamps |
| Immigrants | Colombia | 5.3 /100 | #220 | Tragic 12.9% |
| Bermudans | 4.8 /100 | #221 | Tragic 13.0% |
| Immigrants | Immigrants | 4.4 /100 | #222 | Tragic 13.0% |
| Immigrants | Albania | 4.4 /100 | #223 | Tragic 13.0% |
| Immigrants | Armenia | 4.3 /100 | #224 | Tragic 13.0% |
| Fijians | 4.3 /100 | #225 | Tragic 13.0% |
| Chickasaw | 3.6 /100 | #226 | Tragic 13.1% |
| Nigerians | 3.5 /100 | #227 | Tragic 13.1% |
| Panamanians | 3.5 /100 | #228 | Tragic 13.1% |
| Ottawa | 3.5 /100 | #229 | Tragic 13.1% |
| Puget Sound Salish | 3.4 /100 | #230 | Tragic 13.1% |
| Immigrants | Nigeria | 3.4 /100 | #231 | Tragic 13.1% |
| Salvadorans | 2.7 /100 | #232 | Tragic 13.2% |
| Cherokee | 2.5 /100 | #233 | Tragic 13.2% |
| Comanche | 2.4 /100 | #234 | Tragic 13.3% |