Russian vs Immigrants from Nepal Male Unemployment
COMPARE
Russian
Immigrants from Nepal
Male Unemployment
Male Unemployment Comparison
Russians
Immigrants from Nepal
5.1%
MALE UNEMPLOYMENT
92.9/ 100
METRIC RATING
100th/ 347
METRIC RANK
4.8%
MALE UNEMPLOYMENT
99.8/ 100
METRIC RATING
32nd/ 347
METRIC RANK
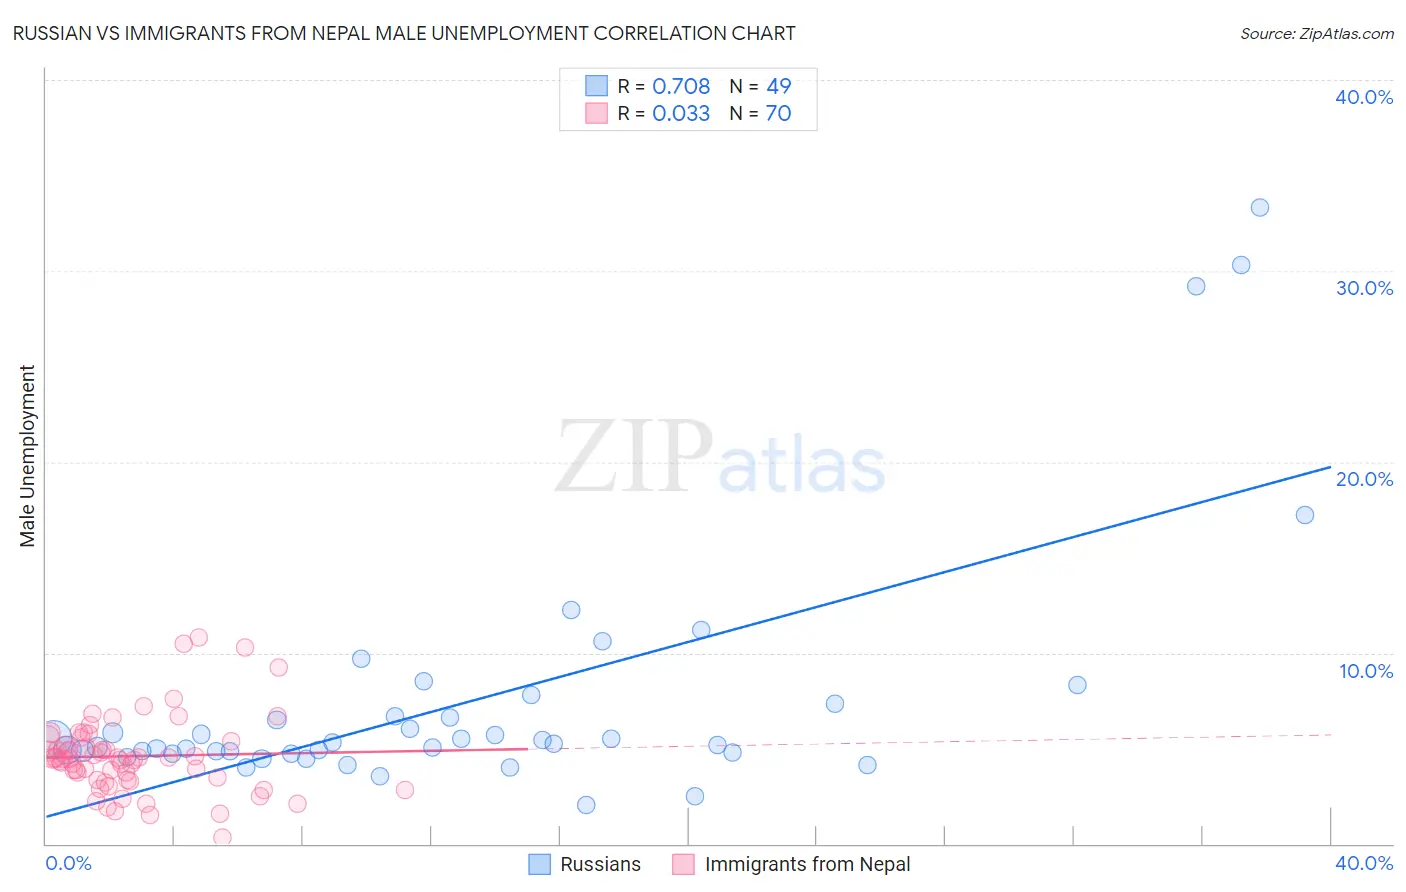
Russian vs Immigrants from Nepal Male Unemployment Correlation Chart
The statistical analysis conducted on geographies consisting of 506,887,579 people shows a strong positive correlation between the proportion of Russians and unemployment rate among males in the United States with a correlation coefficient (R) of 0.708 and weighted average of 5.1%. Similarly, the statistical analysis conducted on geographies consisting of 186,501,953 people shows no correlation between the proportion of Immigrants from Nepal and unemployment rate among males in the United States with a correlation coefficient (R) of 0.033 and weighted average of 4.8%, a difference of 5.5%.
Male Unemployment Correlation Summary
| Measurement | Russian | Immigrants from Nepal |
| Minimum | 2.0% | 0.30% |
| Maximum | 33.3% | 10.8% |
| Range | 31.3% | 10.5% |
| Mean | 7.5% | 4.6% |
| Median | 5.2% | 4.5% |
| Interquartile 25% (IQ1) | 4.8% | 3.4% |
| Interquartile 75% (IQ3) | 7.0% | 5.4% |
| Interquartile Range (IQR) | 2.2% | 2.0% |
| Standard Deviation (Sample) | 6.6% | 2.0% |
| Standard Deviation (Population) | 6.5% | 2.0% |
Similar Demographics by Male Unemployment
Demographics Similar to Russians by Male Unemployment
In terms of male unemployment, the demographic groups most similar to Russians are Uruguayan (5.1%, a difference of 0.020%), German Russian (5.1%, a difference of 0.040%), Immigrants from France (5.1%, a difference of 0.060%), Immigrants from Kuwait (5.1%, a difference of 0.080%), and Immigrants from Spain (5.1%, a difference of 0.12%).
| Demographics | Rating | Rank | Male Unemployment |
| Immigrants | Serbia | 94.2 /100 | #93 | Exceptional 5.1% |
| Canadians | 94.1 /100 | #94 | Exceptional 5.1% |
| Italians | 93.8 /100 | #95 | Exceptional 5.1% |
| Asians | 93.7 /100 | #96 | Exceptional 5.1% |
| Immigrants | Spain | 93.4 /100 | #97 | Exceptional 5.1% |
| Immigrants | Kuwait | 93.3 /100 | #98 | Exceptional 5.1% |
| Uruguayans | 93.0 /100 | #99 | Exceptional 5.1% |
| Russians | 92.9 /100 | #100 | Exceptional 5.1% |
| German Russians | 92.7 /100 | #101 | Exceptional 5.1% |
| Immigrants | France | 92.7 /100 | #102 | Exceptional 5.1% |
| Immigrants | Jordan | 91.9 /100 | #103 | Exceptional 5.1% |
| Immigrants | Chile | 91.8 /100 | #104 | Exceptional 5.1% |
| Immigrants | Czechoslovakia | 91.7 /100 | #105 | Exceptional 5.1% |
| Immigrants | Ethiopia | 91.5 /100 | #106 | Exceptional 5.1% |
| Ethiopians | 91.3 /100 | #107 | Exceptional 5.1% |
Demographics Similar to Immigrants from Nepal by Male Unemployment
In terms of male unemployment, the demographic groups most similar to Immigrants from Nepal are Sudanese (4.8%, a difference of 0.010%), British (4.8%, a difference of 0.26%), Latvian (4.8%, a difference of 0.30%), Welsh (4.8%, a difference of 0.38%), and Scottish (4.8%, a difference of 0.57%).
| Demographics | Rating | Rank | Male Unemployment |
| Zimbabweans | 99.9 /100 | #25 | Exceptional 4.8% |
| Dutch | 99.9 /100 | #26 | Exceptional 4.8% |
| Belgians | 99.9 /100 | #27 | Exceptional 4.8% |
| Bulgarians | 99.8 /100 | #28 | Exceptional 4.8% |
| Scottish | 99.8 /100 | #29 | Exceptional 4.8% |
| British | 99.8 /100 | #30 | Exceptional 4.8% |
| Sudanese | 99.8 /100 | #31 | Exceptional 4.8% |
| Immigrants | Nepal | 99.8 /100 | #32 | Exceptional 4.8% |
| Latvians | 99.7 /100 | #33 | Exceptional 4.8% |
| Welsh | 99.7 /100 | #34 | Exceptional 4.8% |
| Paraguayans | 99.5 /100 | #35 | Exceptional 4.9% |
| Immigrants | Singapore | 99.4 /100 | #36 | Exceptional 4.9% |
| Scotch-Irish | 99.4 /100 | #37 | Exceptional 4.9% |
| Immigrants | Bosnia and Herzegovina | 99.4 /100 | #38 | Exceptional 4.9% |
| Burmese | 99.3 /100 | #39 | Exceptional 4.9% |